Coverage Analysis
Genome coverage (or target exome regions or target panel) allows you to assess how informative the CNV discovery is in general. In this section, you can estimate both the fraction of data covered in general, and how much the genes and transcripts of your interest are covered.
Depth of coverage of target regions (example)
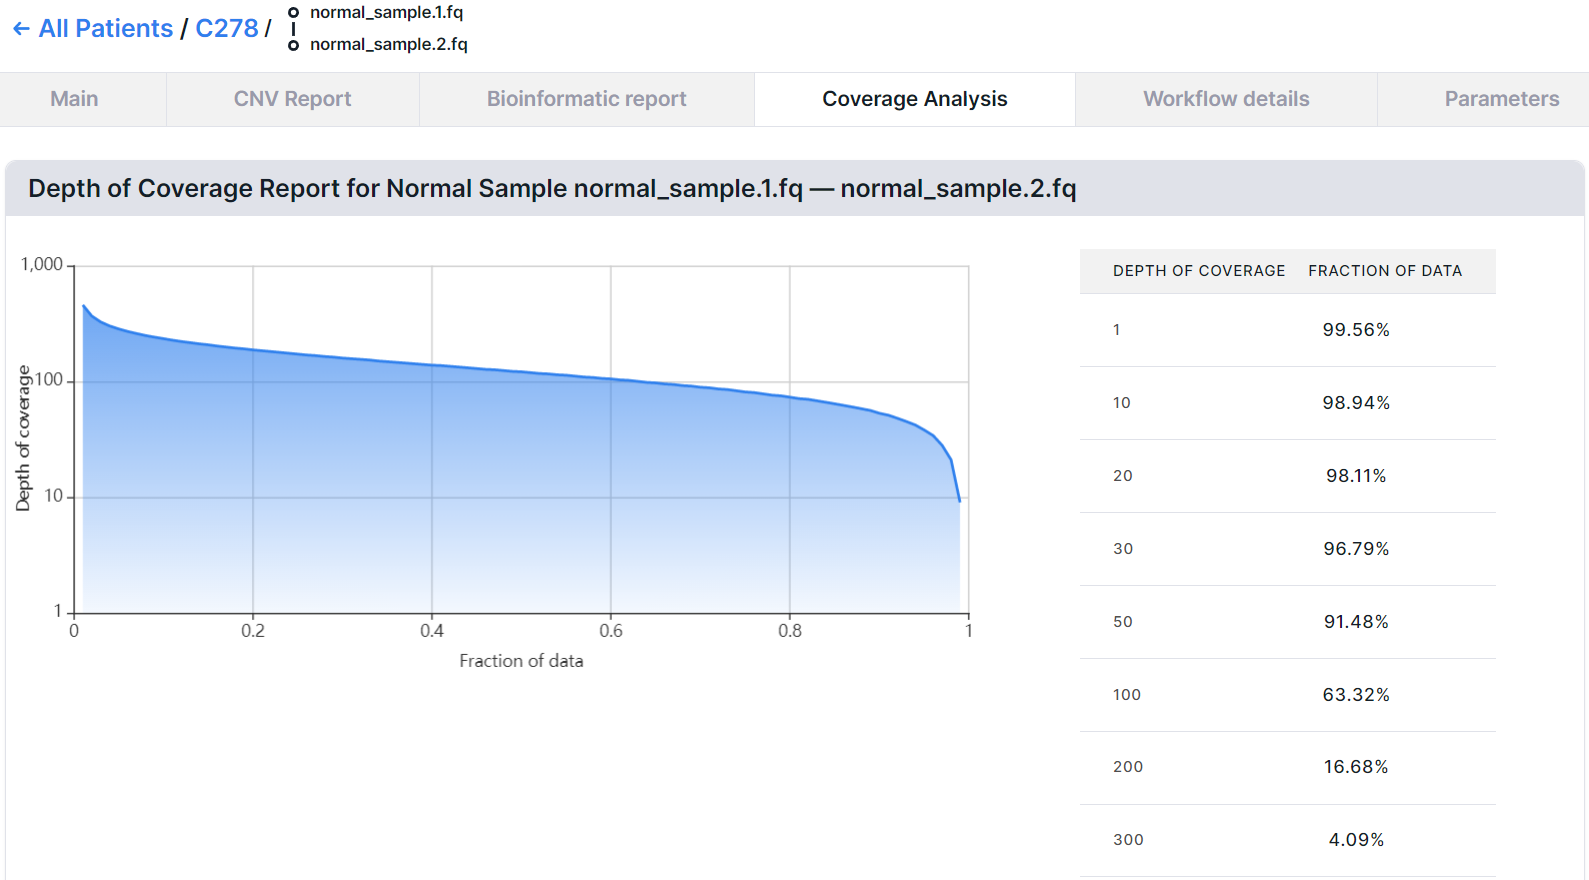
The plot shows which fraction of the genome or target regions is covered at different depths. So, in the example, 96.79% of the target regions are covered with 30 reads, which is a good indicator. For a more accurate assessment of coverage in genes of interest, you can use the search below on the page and select a transcript. To select a transcript, click on the gene name. By default, the transcript of the MANE Clinical database is chosen, if there is no gene in the database, the canonical transcript is chosen according to Ensembl annotation. Search results can be exported as a table.
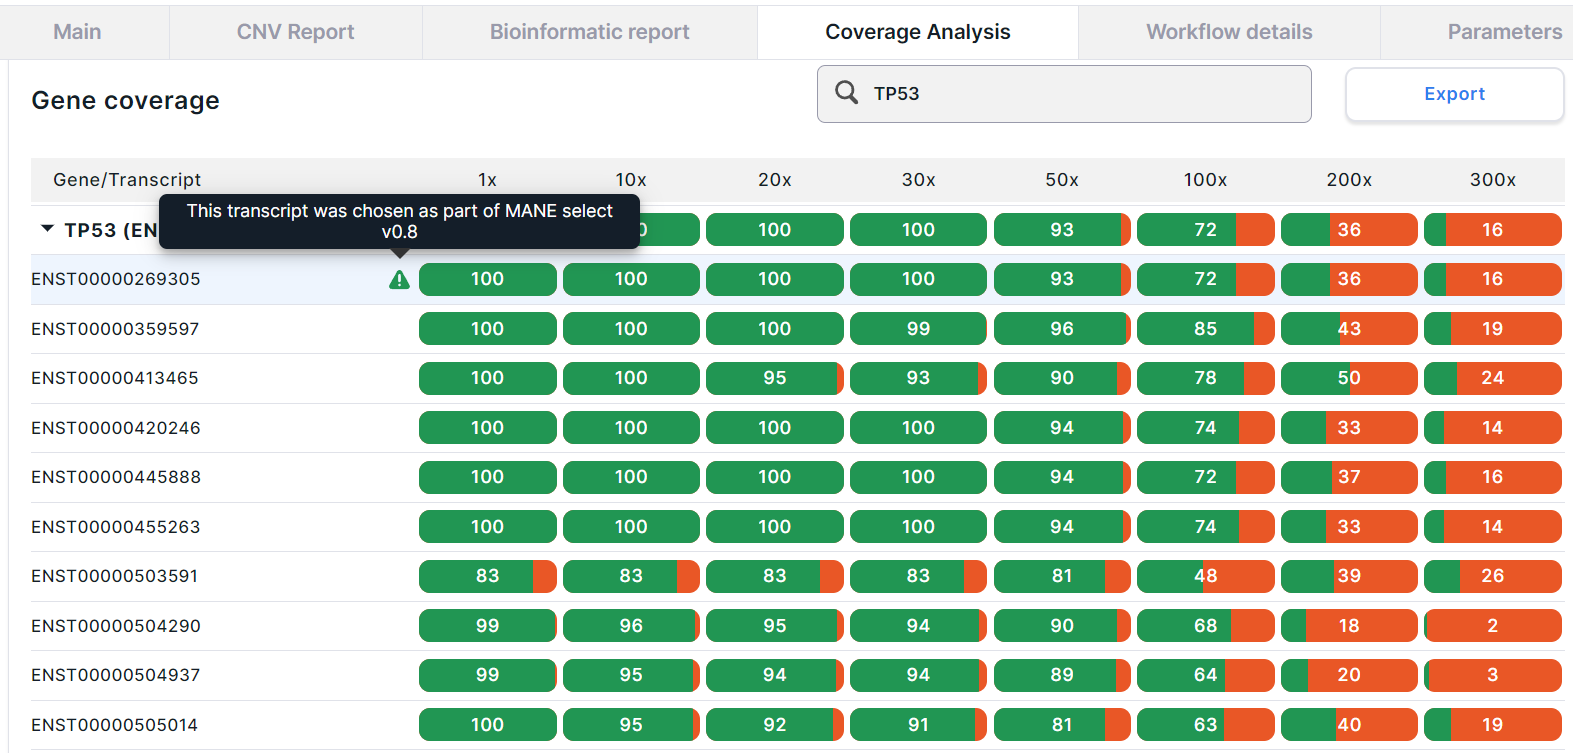
TP53 gene coverage