Bioinformatic Report
The "Bioinformatics report" tab on the sample page includes key metrics that help to control raw data quality, alignment quality, and data coverage, as well as reports on discovered SNVs/Indels.
note
Bioinformatic report of tumor sample from tumor/control sample set provides information for the tumor and control sample files:
Bioinformatic report of non-tumor tissue samples and single tumor samples provides information about the files of only these samples.
Bioinformatic report may include different sections depending on the format of the uploaded samples and the analysis stages included in the pipeline. Possible sections of the report:
- File statistics - for samples uploaded in FASTQ or BAM format.
- Quality Report - for samples uploaded in FASTQ or BAM format.
- Alignment Report - for samples uploaded in FASTQ or BAM format, for which the "Alignment" stage was included in the pipeline and completed successfully.
- Coverage Report - for samples uploaded in FASTQ or BAM format, for which the "Alignment" stage was included in the pipeline and completed successfully.
- Tumor Sample Somatic SNVs/Indels Report - for samples for which "Somatic SNVs/Indels discovery" and "Somatic SNVs/Indels annotation" stages were included in the pipeline and successfully completed.
- Germline SNVs/Indels Report - for samples for which "Germline SNVs/Indels discovery" and "Germline SNVs/Indels annotation" stages were included in the pipeline and successfully completed.
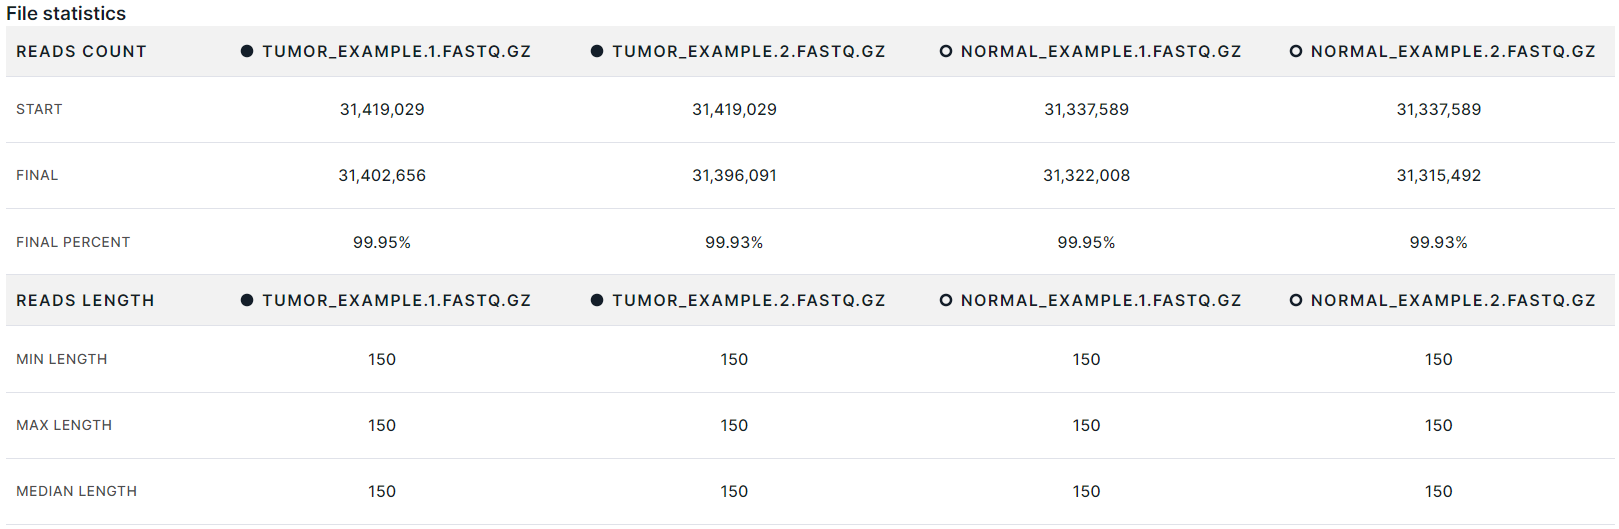
File statistics#
note
Only samples uploaded in FASTQ or BAM format have this section.
- Data on reads count:
- Start: the number of reads in the sample file after it was verified, but before cleanup.
- Final: the number of reads in the sample file counted during the quality check after cleanup.
- Final percent: the percentage of reads that retained in the file after cleanup.
- Data on reads length:
- Min length: the minimum read length in the sample file.
- Max length: the maximum read length in the sample file.
- Median length: the average value of the read length in the sample file.
caution
A large number of filtered reads and a large decrease in read length indicate a low quality of the source data. In this case, we recommend you to consider re-sequencing the material.
Quality Report#
note
Only samples uploaded in FASTQ or BAM format have this section.
The report contains the metrics of the final read quality (after cleaning, if any), calculated at the “Check quality and cleanup” stage. You can download a detailed report on metrics with visualization in the corresponding section of "Workflow details" tab.
Quality Control Metrics#
| Metric | Description | The threshold value of the metric at which reads in the sample are considered to be of high quality (default value, can be changed in the settings) |
| Total sequences | Number of sequences | >200 000 |
| Length distribution | Sequence length distribution | Short sequences percent < 25%, short sequence length ≤ 20 |
| Tiles sequence quality | Number of tiles | Number of tile bad quality cells with maximum deviation 1,165 < 7 |
| First base sequence quality | First nucleotides quality | 10% of the lowest quality first bases (3 nucleotides) are of quality > 20 |
| Middle base sequence quality | Middle nucleotides quality | 10% of the lowest quality middle bases are of quality > 20 |
| Last base sequence quality | Last nucleotides quality | 10% of the lowest quality last bases (3 nucleotides) are of quality > 20 |
| Overrepresented sequences | Overrepresented sequences | Overrepresented sequences percent < 1 |
| Adapter contaminated | Adapter sequence contamination | Adapter contaminated percent < 1 |
| Base N content | Number of N among bases | N content percent < 20 |
| GC content | GC content | Presence of one GC peak |
| Base sequence content | AT/GC ratio | Average difference between A and T < 1%, maximum difference < 20%. Average difference between G and C < 1%, maximum difference < 20%. |
Metrics that meet the quality threshold are marked
with ![]() , and those that do not meet the threshold are marked with
, and those that do not meet the threshold are marked with ![]() .
.
Alignment Report#
note
The section is available for samples for which the alignment was included in the pipeline and completed successfully.
The section includes alignment statistics and metrics that describe alignment quality. If there are a lot of sequencing errors, incomplete data, a high level of contamination, or incorrect identification of the sample source (organism), the metrics will indicate a possible problem.
- Alignment statistics:
- Total reads is the total number of reads in the alignment file.
- Mapped reads is the number of sample reads that have been mapped to the reference genome. The proportion of the number of such reads from the total number of reads in the file is indicated in brackets (in percent).
- Unmapped reads is the number of sample reads that could not be mapped to the reference genome. The proportion of the number of such reads from the total number of reads in the file is indicated in brackets (in percent).
- Multumaps reads is the number of reads mapped to the reference genome multiple times. The proportion of the number of such reads from the total number of reads in the file is indicated in brackets (in percent).
- Forward strand reads is the number of forward strand reads mapped to the reference genome. The proportion of the number of such reads from the total number of reads in the file is indicated in brackets (in percent).
- Reverse strand reads is the number of reverse strand reads mapped to the reference genome. The proportion of the number of such reads from the total number of reads in the file is indicated in brackets (in percent). Normally, the number of forward and reverse strand reads is the same. The difference in this number indicates that there are DNA translocations (for example, inversions) in the data.
- Paired reads is the total number of paired reads in the alignment file. The proportion of the number of such reads from the total number of reads in the file is indicated in brackets (in percent).
- Paired mapped reads is the number of paired reads of a sample that have been mapped to the reference genome. The proportion of the number of such reads from the total number of reads in the file is indicated in brackets (in percent).
- Paired properly mapped reads is the number of paired reads of a sample properly mapped to the reference genome. The proportion of the number of such reads from the total number of reads in the file is indicated in brackets (in percent).
- Total alignments is the total number of alignments of sample reads to the reference genome
- Multumaps alignments is number of alignments of a read to the reference genome several times. The proportion of the number of such alignments from the total number of alignments in the file is indicated in brackets (in percent).
- Forward strand alignments is the number of forward strand read alignments to reference genome. The proportion of the number of such alignments from the total number of alignments in the file is indicated in brackets (in percent).
- Reverse strand alignments is the number of reverse strand read alignments to reference genome. The proportion of the number of such alignments from the total number of alignments in the file is indicated in brackets (in percent).
- Percent duplication is the proportion of the mapped sequence that was marked as a duplicate (in percent). The statistics is included in the report if the "Mark Duplicates" stage was included in the pipeline and completed successfully for the sample.
- Alignment Quality Metrics:
| Metric | Description | The metric threshold value by default (can be changed in the settings) |
| Mapped reads | The proportion of the number of mapped reads (in percent) of the total number of reads in the alignment file. | ≥ 85 |
| Multiple alignments | The proportion of multiple alignments of the same read to the genome (in percent) of the total number of alignments in the alignment file. | ≤ 15 |
| Forward/reverse balance | The difference in the number of forward and reverse strand reads from the total number of reads in the alignment file (in percent). | ≤ 10 |
| Paired mapped reads | The proportion of the number of paired mapped reads (in percent) of the total number of reads in the alignment file. | ≥ 80 |
| Paired properly mapped reads | The proportion of the number of paired properly mapped reads (in percent) of the total number of reads in the alignment file. | ≥ 75 |
Metrics that meet the quality threshold are marked
with ![]() , and those that do not meet the threshold are marked with
, and those that do not meet the threshold are marked with ![]() .
.
Coverage Report#
note
The section is available for samples for which the alignment was included in the pipeline and completed successfully.
The coverage report shows how informative the analysis of the sample is.
- Coverage per nucleotide is the coverage per nucleotide on the genome. The metric threshold is ≥ 0.1.
If the metric meets the quality threshold, it is marked
with
 , and if it doesn't meet the threshold, then it is marked with
  .
. - PCT selected bases is the proportion (in percent) of PF_BASES_ALIGNED (the number of filtered unique bases that are mapped to the reference genome with a mapping score > 0) located in or near the baited region, which is calculated by the formula (ON_BAIT_BASES + NEAR_BAIT_BASES)/PF_BASES_ALIGNED, where ON_BAIT_BASES is the number of PF_BASES_ALIGNED mapped to the baited region of the genome; NEAR_BAIT_BASES is the number of PF_BASES_ALIGNED mapped to the fixed interval region containing the baited region but not to the region itself. The metric is included in the report for samples sequenced with a targeted panel if the "Calculate coverage statistics" stage is successfully completed.
- PCT usable bases on target is the proportion (in percent) of the number of mapped deduplicated target bases out of all filtered bases. The metric is included in the report for samples sequenced with a targeted panel if the "Calculate coverage statistics" stage is successfully completed.
- Mean target coverage is the mean coverage of target region. The metric is included in the report for samples sequenced with a targeted panel if the "Calculate coverage statistics" stage is successfully completed.
- Median target coverage is the median coverage of the target region. The metric is included in the report for samples sequenced with a targeted panel if the "Calculate coverage statistics" stage is successfully completed.
Somatic or Germline SNVs/Indels Report#
note
"Tumor Sample Somatic SNVs/Indels Report" section is available for samples for
which the "Somatic SNVs/Indels discovery" stage
was included in the pipeline, and the "Somatic SNVs/Indels annotation" stage was completed successfully.
"Tumor Sample Germline SNVs/Indels Report"
section is available for single tumor samples (analyzed without control) for
which the "Germline SNVs/Indels discovery" stage
was included in the pipeline, and the "Germline SNVs/Indels annotation" stage was completed successfully.
"Normal Sample Germline SNVs/Indels Report"
section is available for tumor (analyzed with control) and normal samples for
which the "Germline SNVs/Indels discovery" stage
was included in the pipeline, and the "Germline SNVs/Indels annotation" stage was completed successfully.
- Variant count:
- Total is the total number of single-nucleotide variants (SNVs) and short insertions/deletions (indels) discovered in the sample. Number in brackets indicates the number of genes in which the discovered variants are located.
- SNV count is the number of single-nucleotide variants (SNVs) discovered in the sample.
- Indel count is the number of short insertions/deletions (indels) discovered in the sample.
- Genome position:
- Exonic is the number of variants located in an exon:
- Frameshift is the number of insertions or deletions that cause a frameshift;
- Start loss is the number of variants that cause a start codon to mutate to a non-start codon;
- Stop gain is the number of variants leading to a stop codon;
- Stop loss is the number of variants that cause a stop codon to mutate to a non-stop codon;
- Missense is the number of variants resulting in a codon that codes for a different amino acid;
- Inframe indel is the number of insertions/deletions of one or more codons;
- Synonymous is the number of variants resulting in a codon that codes for the same amino acid;
- 5'UTR is the number of variants located in the 5'-untranslated region;
- 3'UTR is the number of variants located in the 3'-untranslated region;
- Intronic is the number of variants located in an intron.
- Intergenic is the number of variants located in the intergenic region:
- Upstream is the number of variants located 5' of a gene;
- Downstream is the number of variants located 3' of a gene.
- In splice site is the number of variants located in splice site.
- In non-protein-coding transcript is the number of variants located in non-protein-coding transcript.
- Known variants are variants, information about which is contained in various databases, such as dbSNP, COSMIC (if the database was uploaded as a custom annotation), 1000 Genomes, gnomAD 3, ClinVar (indicating the number of variants with a certain clinical significance of the phenotype; you can see the definitions of values here), dbNSFP.
Report export#
Bioinformatic report can be downloaded in PDF format. To do this, click on
the button  in the upper right corner of the
report page.
in the upper right corner of the
report page.