Report on Polygenic Traits
Polygenic traits are traits, such as height or weight, that are caused by the action of multiple genes. In addition to genetics, polygenic traits are influenced by many other factors, such as environment, socioeconomic factors, and lifestyle. The genetic component of polygenic traits is assessed using polygenic risk score (PRS). PRS incorporates the effects of many genetic variants into one number that predicts the genetic predisposition for trait. Each PRS value can be plotted on a PRS distribution frequency plot (the bell-shaped curve). For most people, their PRS values will be in the middle region, but for some, these values may deviate to the left or right of the average, which will indicate the presence of a lower or higher value of the polygenic trait.
To calculate polygenic traits, predictive models (logistic regression model and Cox regression model) are used that take into account PRS values, as well as parameters such as sex and age (allowable range: from 18 to 80 years). Polygenic risk models are a vector of variant effect scores identified for a trait based on the results of genome-wide association studies and taking into account the structure of linkage disequilibrium. The models are constrained by a list of common genetic variants represented in the HapMap 3 data set. The logistic regression model allows you to determine the relationship between the presence or absence of a disease and predictor variables. The Cox regression model takes into account the age of onset of the disease and, accordingly, allows you to see the dynamics of the risk of developing the disease with age. More about comparing these models: Ingram DD, Kleinman JC. Empirical comparisons of proportional hazards and logistic regression models. Stat Med. 1989 May;8(5):525-38. The final prediction of the models is not absolutely accurate, since the list of genetic variants influencing polygenic traits is constantly being supplemented by the scientific community. How well a statistical model predicts the presence or absence of a disease in a person is determined by the AUC (Area Under the Receiver Operating Characteristic Curve) index. The AUC value ranges from 50% to 100%, where higher values indicate that the model has more predictive power.
Report Generation#
The report is based on the "Polygenic traits" report template block, which can only be applied to non-tumor samples. The block regulates polygenic risk score calculation results for which traits will be included in the report.
Report on polygenic traits is generated for a sample if the following conditions are met:
- The sample is uploaded as a non-tumor sample (a sample of the "NORMAL" type).
- The sample analysis has been successfully completed (i.e. all stages included in the workflow have the "Complete" status).
- The "Polygenic risk scores calculation" task of the "Genomic predictions" analysis stage has been successfully completed for the sample. By default, the task is not included in the analysis workflow, so it must be included in the parameters by activating the "Run polygenic risk scores calculation" option. Please note that to include polygenic risk scores calculation in the analysis workflow of a sample uploaded in VCF or GT format, you must select the setting preset, which includes the "Run polygenic risk scores calculation" parameter, at the stage of composing a sample set.
- The report template, which includes the "Polygenic traits" block, is active (adjusted on the "Report templates" page).
- The report template was added to the system before the sample processing has been completed.
After a report on polygenic traits has been successfully generated, open the report tab from the sample page. To calculate a report, you must specify the patient's age (date of birth) and sex, which are taken into account when building a predictive model for calculating polygenic risk scores. This can be done on the patient page or on the report page itself. If the patient is under 18 years old, the extreme lower limit will be used as the age value of 18 y.o. for calculations, since the predictive model uses a range from 18 to 80 years old. If the patient is over 80 years old, the extreme upper limit will be used as the age value of 80 y.o. for calculations, since the predictive model uses a range from 18 to 80 years old. If the patient's sex is not specified, the sex value determined from genetic data is used (the "Determining sex" task of the "Genomic predictions" stage). After specifying the patient's age and sex, you need to wait a bit while the values required for generating the report are calculated.
Results#
Which polygenic traits will be included in the report is defined in the report template block. Quantitative and binary polygenic traits are available for selection.
Quantitative Polygenic Trait Prediction Results#
Quantitative traits are characteristics whose individual manifestations have a numerical expression. For such traits, the polygenic risk score (PRS) is estimated and displayed on a PRS frequency distribution plot, which makes it possible to determine the patient's position relative to the distribution of values in the population.
The following quantitative polygenic risks are calculated:
- Height;
- Weight;
- Body Mass Index (BMI);
- Trunk fat mass;
- Trunk fat-free mass;
- Hip circumference;
- Insulin-like growth factor 1 level;
- Fasting glucose level;
- Fasting insulin level;
- Hemoglobin level;
- Hematocrit;
- Bone mineral density;
- Neuroticism score.
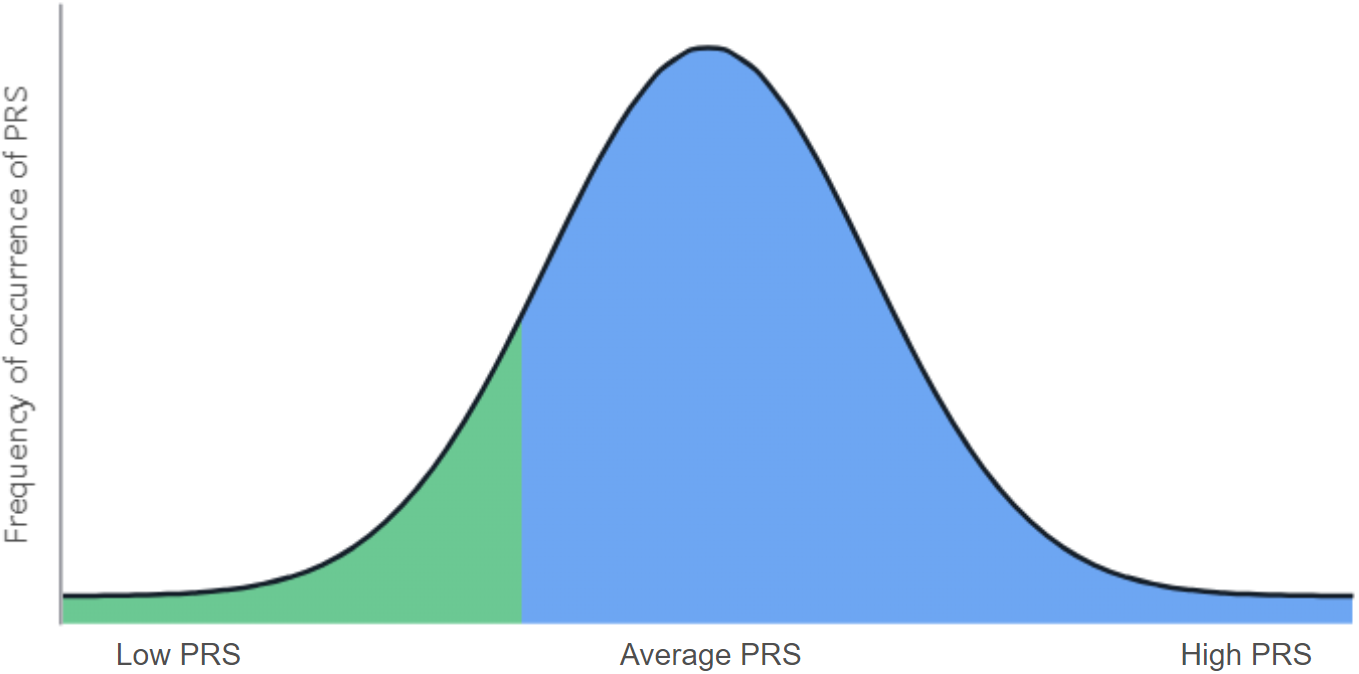
The predicted polygenic risk score (PRS) is presented as a PRS frequency distribution plot. The range of the patient's PRS values is highlighted in green (if the values fall within the low or average PRS range) or orange (if the values fall within the high PRS range), while the remaining area is highlighted in blue. In the plot below, the PRS values are shifted to the left of the mean, indicating a lower value of the polygenic trait:
The patient's PRS is also compared with the PRS values of people from a group with a similar ethnic background. The comparison provides the percentage of people in the reference cohort whose PRS is greater or lower than the patient's PRS.
For quantitative traits such as height, weight, and BMI, a corresponding predictive model has been developed to additionally determine the absolute value of the trait based on the patient's genetic data, sex, and age. Since the predictive model determines the trait value with a certain degree of error, a confidence interval describing the range of possible trait values is also calculated for these traits.
In addition to the PRS frequency distribution plot, the following results are provided for the Genetic Height, Genetic Weight, and Genetic Body Mass Index traits:
- Predicted trait value - the absolute value of the trait determined using a logistic regression model that takes into account the patient's genetic data, sex, and age. In the diagram below, the predicted trait value is the patient's genetic height (162 cm).
- Range of possible trait values - a 95% confidence interval that, with a high degree of confidence, includes the absolute trait value. The interval is calculated using the logistic regression model. In the diagram below, the range of possible values is a height of 153 to 172 cm.
- Comparison of the predicted value with the mean trait value - an indication of how much the patient's predicted trait value is lower or higher than the mean trait value determined based on the patient's ethnicity, sex, and age. In the diagram below, the mean trait value is the mean genetic height (166 cm).

Binary Polygenic Trait Prediction Results#
Binary traits are characteristics with two possible outcomes: the presence or absence of a particular condition (for example, susceptibility or resistance to a specific infection).
The following binary polygenic risks are calculated:
- Predisposition to Being Overweight;
- Predisposition to Coronary Artery Disease;
- Predisposition to Inflammatory Bowel Disease;
- Predisposition to Type 2 diabetes;
- Predisposition to Chronic Renal Failure;
- Predisposition to Asthma;
- Predisposition to Idiopathic Pulmonary Fibrosis;
- Predisposition to Thyrotoxicosis;
- Predisposition to Alcohol-Associated Liver Cirrhosis;
- Predisposition to Alzheimer's Disease;
- Predisposition to Parkinson's Disease;
- Predisposition to Prostate Cancer (if the patient's sex is indicated as male);
- Predisposition to Breast Cancer (if the patient's sex is indicated as female);
- Predisposition to Colorectal Cancer;
- Predisposition to Risk-Taking Behaviour;
- Predisposition to Hospitalization for COVID-19;
- Predisposition to Severe COVID-19.
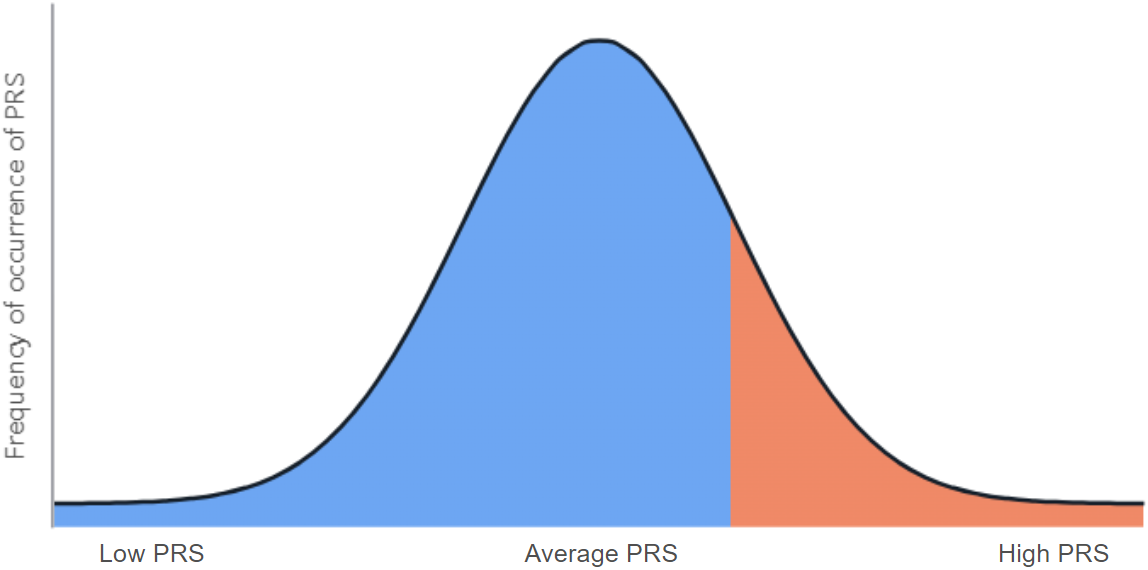
The predicted polygenic risk score (PRS) is presented as a PRS frequency distribution plot. The range of the patient's PRS values is highlighted in green (if the values fall within the low or average PRS range) or orange (if the values fall within the high PRS range), while the remaining area is highlighted in blue. In the plot below, the PRS values are shifted to the right of the mean, indicating a higher polygenic risk:
The patient's PRS is also compared with the PRS values of people from a group with a similar ethnic background. The comparison provides the percentage of people in the reference cohort whose PRS is higher or lower than the patient's PRS.
For some binary traits (overweight, coronary artery disease, inflammatory bowel disease, type 2 diabetes, chronic renal failure, asthma, idiopathic pulmonary fibrosis, alcohol-associated liver cirrhosis, Alzheimer's disease, Parkinson's disease, breast cancer, prostate cancer, colorectal cancer, risk-taking behavior, COVID-19 hospitalization, and severe COVID-19), the predictive model performance metric is additionally provided to assess genetic predisposition to the respective condition. The metric is determined using the AUC (Area Under the Receiver Operating Characteristic Curve) parameter.
In the diagram below, the predictive model performance metric is 75% for the trait under study and the patient's ethnic group:

For some binary traits (overweight, coronary artery disease, inflammatory bowel disease, type 2 diabetes, breast cancer, prostate cancer, colorectal cancer, COVID-19 hospitalization, and severe COVID-19), the following results are additionally provided:
- Predicted risk of developing the condition for the patient - the value determined using a logistic regression model that takes into account the patient's genetic data, sex, and age. The value is presented in the diagram as the "Patient risk" block. The block is highlighted in green if the patient's risk is lower than the mean risk, or in orange if the patient's risk is higher than the mean risk. In the diagram below, the predicted risk of developing the condition is 21%.
- Comparison of the patient's predicted risk with the mean risk of developing the condition. The mean risk is determined based on the patient's ethnic background, sex, and age, and is presented in the diagram in the blue "Mean risk" block. In the diagram below, the mean risk of developing the condition is 12%. The comparison provides information on how many times the patient's genetic risk is greater or lower than the mean risk in a group of people with a similar ethnic background.

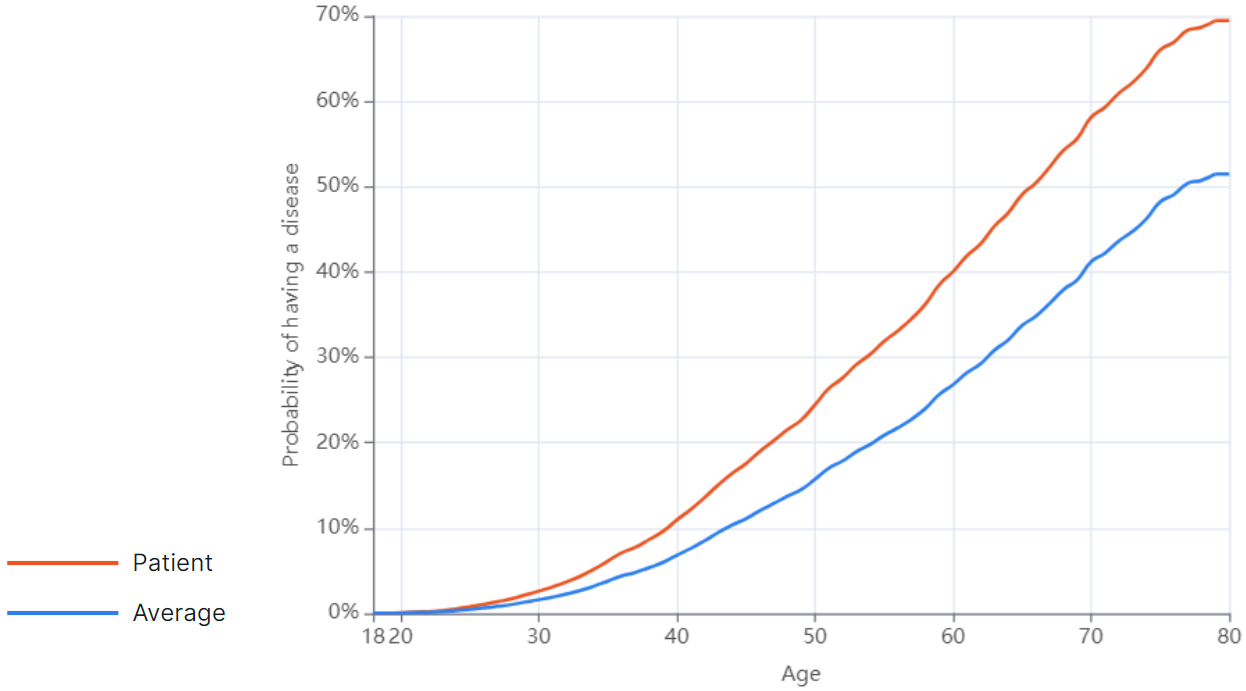
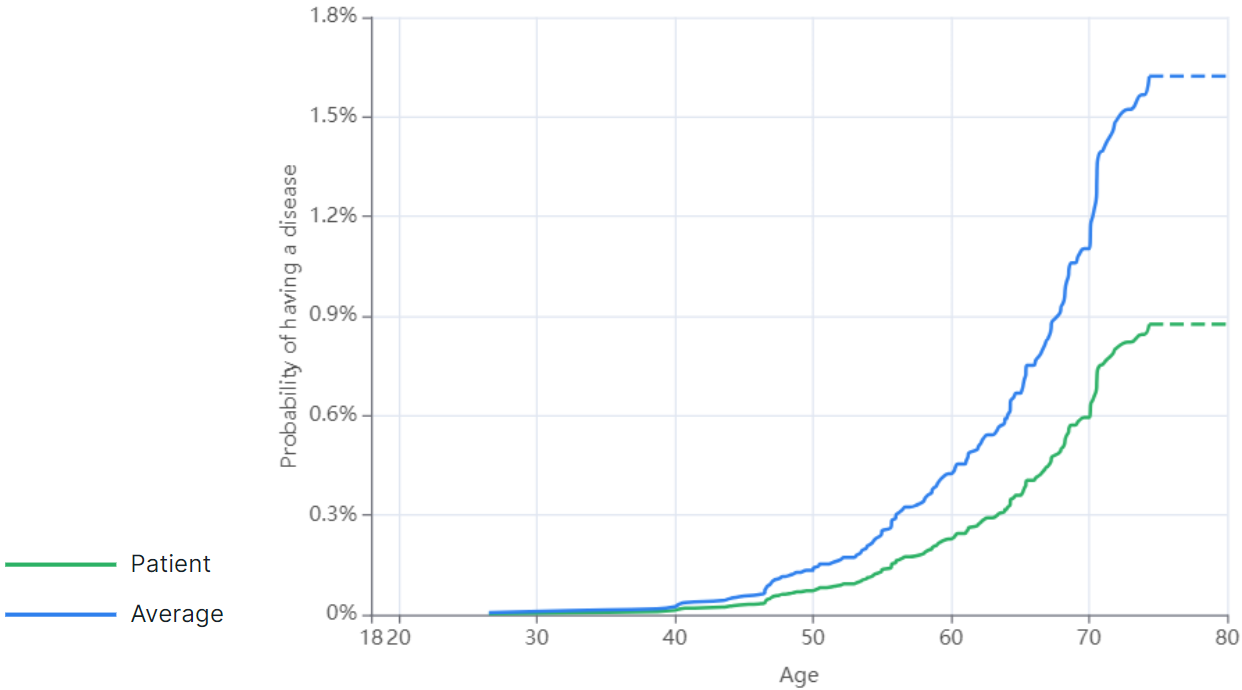
- Assessment of the risk of developing the condition depending on age - an assessment of risk that takes into account the patient's genetic predisposition and compares the resulting risk with the average risk values for people with a similar ethnic background. The relationship between the probability of developing the condition and age is presented as a plot. The patient's risk curve is highlighted in green if the patient's risk is lower than average, or in orange if the patient's risk is higher than average. The average risk curve is highlighted in blue.
Example of a plot where the patient's risk of developing the condition depending on age is lower than average:
Example of a plot where the patient's risk of developing the condition depending on age is higher than average: