Copy Number Variations
The "Somatic Copy Number Variations" and "Germline Copy Number Variations" sections contain the results of discovery of somatic and germline, respectively, copy number variations (CNVs) and calculating copy number values for a given sample against other samples.
Somatic variations occur after conception and are not passed on to children. They can cause cancer or other diseases. Somatic variations discovery is carried out only for tumor tissue samples and, therefore, the results are presented only on the tumor tissue sample page.

Germline variations can be discovered in any cells of the body and are passed on from parents to offspring. Accordingly, germline variations discovery is carried out both for tumor tissue samples (in the case of single tumor tissue samples without control) and for non-tumor tissue samples. For a set of tumor/normal samples, the results of the germline variations discovery in the normal sample are presented on the pages of both samples of the set.

For a single tumor sample without control, the results of discovery of somatic and germline variations are combined into one section:

The detected and annotated copy number variations (CNVs) are presented in all sections as:
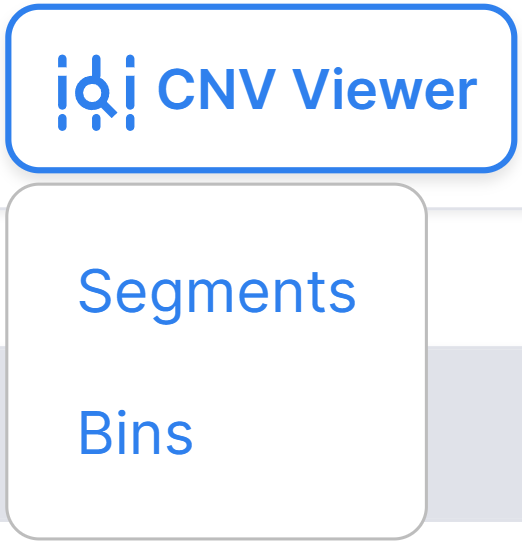
- CNV Viewer is an embedded service for viewing and analyzing variations. Described in detail
in the corresponding section. By clicking on the
button
 , you will see two options:
“Segments” and “Bins”, which open the CNV Viewer with the copy number variations discovered in the
segments or bins, respectively:
- File in AnnotSV CSV format that is a table of annotated copy number variations. They are presented either
like a complete deletion or insertion, or like genes overlapped by a deletion/insertion. By clicking on the
button
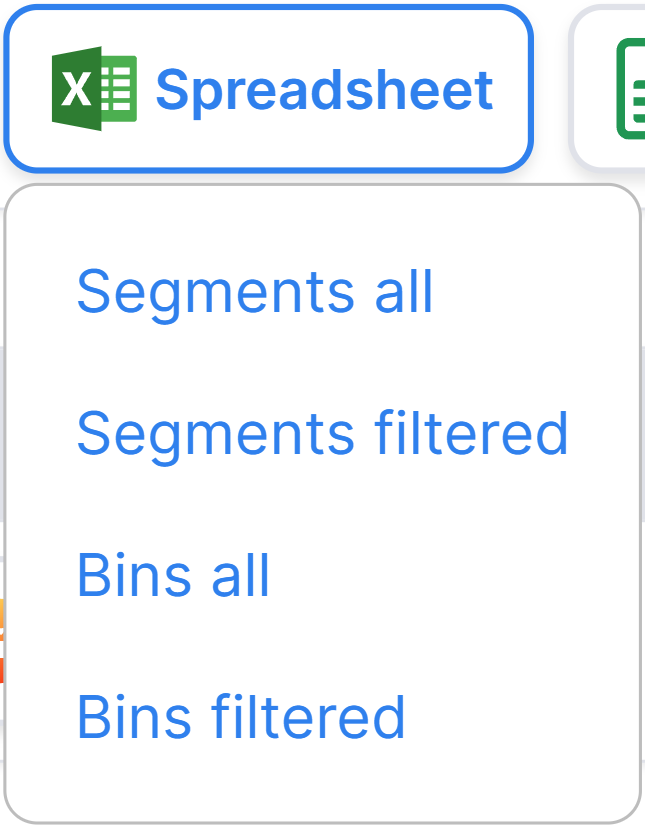
, you will see options for downloading. Their number will depend on whether any variations remain after filtering. Possible options are "Segments all", "Segments filtered", "Bins all" and "Bins filtered". To download a file with annotated variations discovered in segments or bins, before or after filtering, select the appropriate option:
Click to see the main fields of AnnotSV CSV
The main fields of AnnotSV CSV#
| Field | Description |
| AnnotSV_ID | Variation ID assigned by the annotator |
| SV_chrom | Chromosome |
| SV_start | Variation start position in the chromosome |
| SV_end | Variation end position in the chromosome |
| SV_length | Variation length |
| SV_type | Variation type: DEL - deletion, DUP - duplication |
| Filter | Filtering value: PASS (variation satisfies all filters) or empty (variation did not pass filtering). The value will always be "PASS" in the files after filtering. |
| log2FC | The logarithmic ratio of the discovered copy number to the normal copy number (equals 2 for autosomes and the X chromosome in the case of the XX genotype, or 1 for the sex chromosomes in the case of the XY genotype). |
| deltaCP | Relative copy number is the number of copies of a certain region per haploid genome. |
| Annotation_mode | Annotation line type: “full” - annotation of all complete variations, “split” - annotation of a variation split by gene. Each full annotation row can correspond to several split annotation rows. |
A description of the remaining 126 annotation fields can be found here: AnnotSV Manual.
- File in Google Spreadsheet (only a limited number of variations can be shown). By clicking on the
button
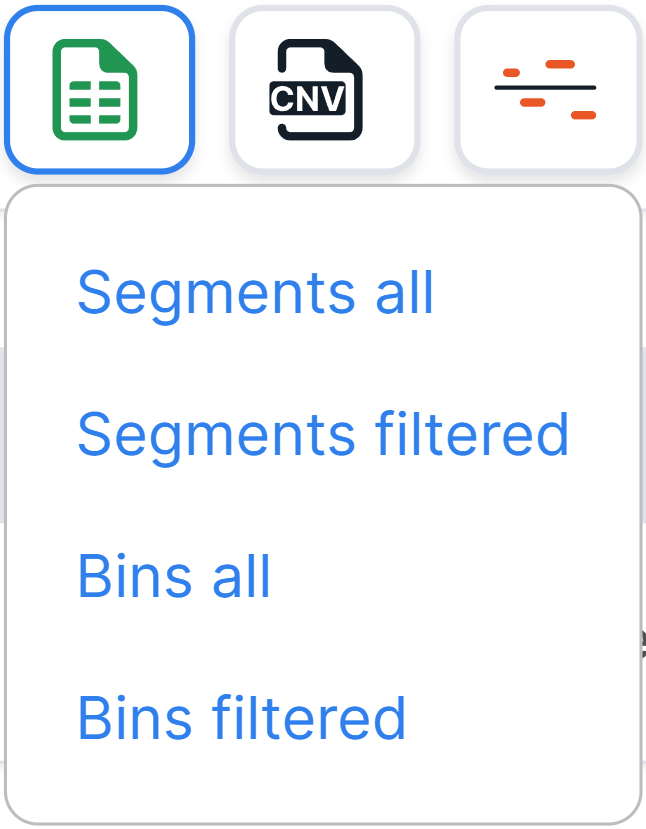
, you will see file options. Their number will depend on whether any variations remain after filtering. Possible options are "Segments all", "Segments filtered", "Bins all" and "Bins filtered". To open a file with annotated variations discovered in segments or bins, before or after filtering, select the appropriate option:
- CNV coverage file in TSV format that is an unannotated file, convenient for analysing copy number
variations in large regions (chromosome arms, chromosomes). To download the file,
click on
.
Click to see the main fields of CNV coverage file
The main fields of CNV coverage file#
| Field | Description |
| ID | Region name (chromosome arm, chromosome) |
| Call | CNV discovery result. Possible values are "+" (increasing the number of copies compared to normal), "-" (reducing the number of copies compared to normal), "." (no deviations from the normal chromosome copy number were found) and "Not considered" (the locus was not considered at all in the analysis). |
| Ampl_cov | Coverage (in nucleotides) of the effective locus length with segments with a copy number above the amplification threshold |
| Ampl_cov_frac | Fraction (in %) of the effective locus length covered by segments with a copy number above the amplification threshold |
| Arm | Chromosome arm |
| Chrom | Chromosome |
| Depl_cov | Coverage (in nucleotides) of the effective locus length with segments with a copy number below the depletion threshold |
| Depl_cov_frac | Fraction (in %) of the effective locus length covered by segments with a copy number below the depletion threshold |
| Effective_end | Maximum coordinate value of effective length |
| Effective_length | Total effective length |
| Effective_start | Minimum coordinate value of effective length |
| End | End coordinate of the variation |
| Length | Variation length |
| Region type | Locus type: arm or whole chromosome |
| Start | Start coordinate of the variation |
| is_masked | If the repeats masking was carried out in the sequence: True/False |
| seg_val | Segment average value |
- Genome-wide CNV segments' plot. By clicking on the
button
, you will see the following options:
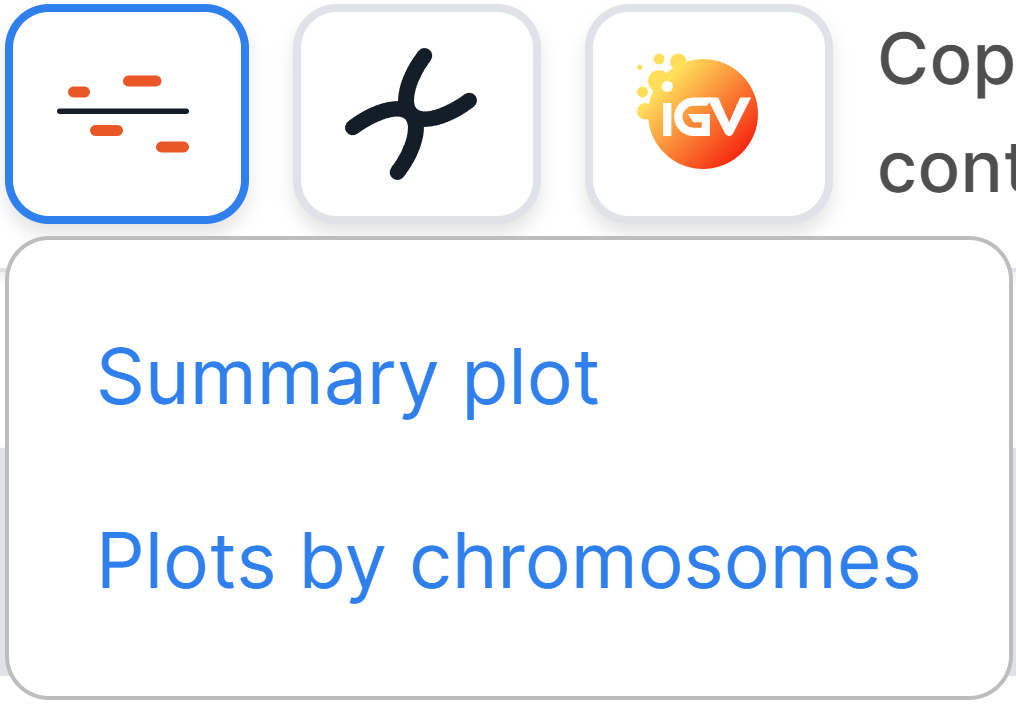
- The "Summary plot" option opens a genome-wide CNV segments' plot in JPG format. Plot example:
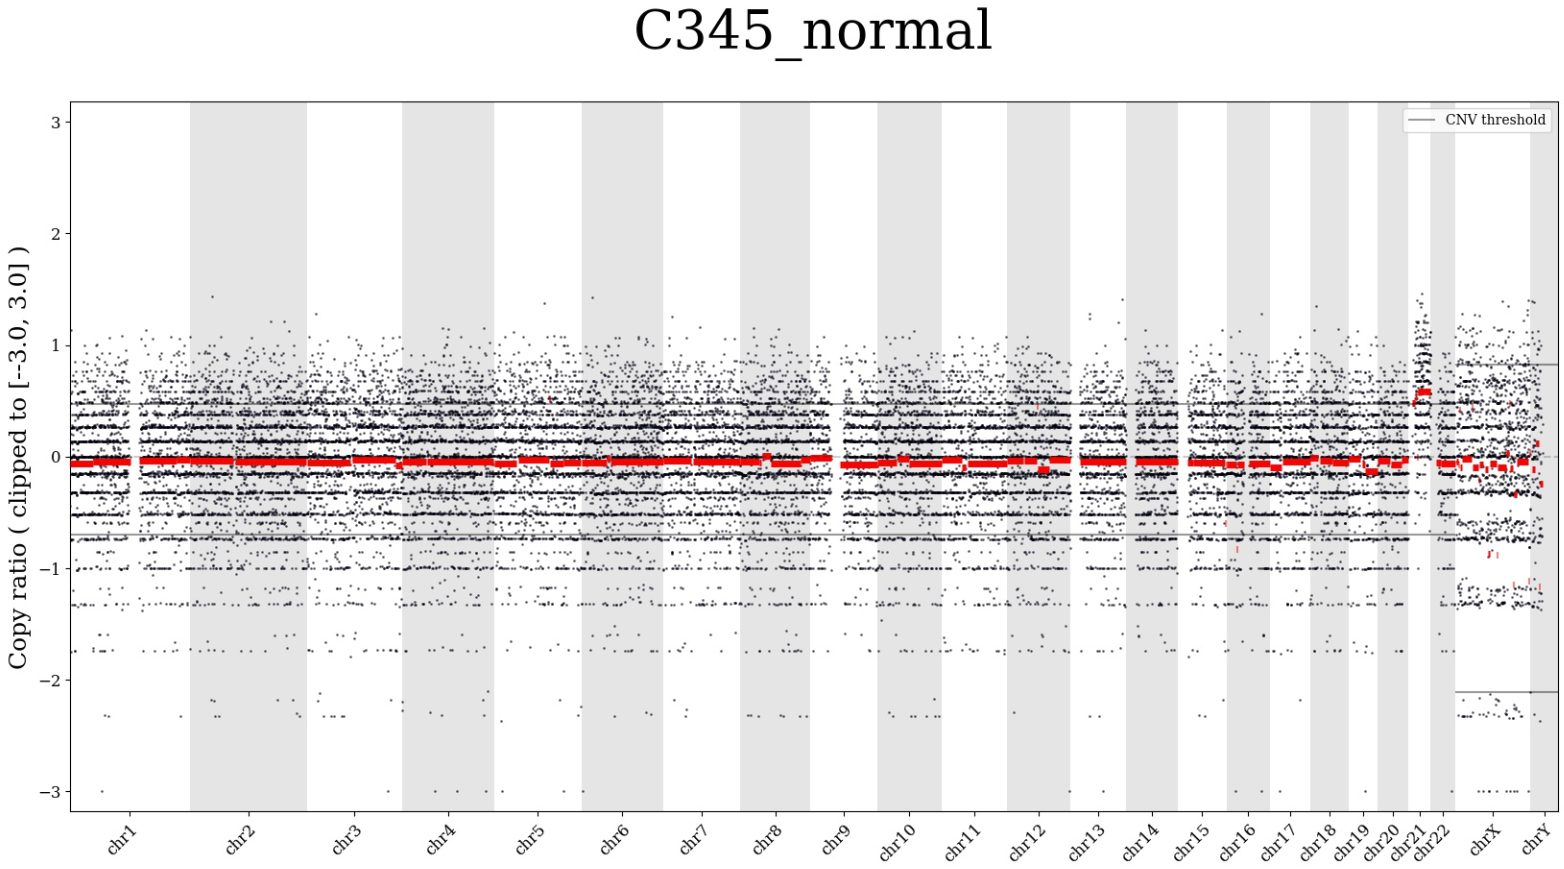
We can see the chromosomes on a horizontal scale and the copy number in chromosomes on a vertical scale. In the given example, the copy number of chromosome 21 is increased in the sample compared to normal diploid number of copies.
- The "Plots by chromosomes" option opens a PDF file with CNV segments' plots for each chromosome. Plot example for chr21:
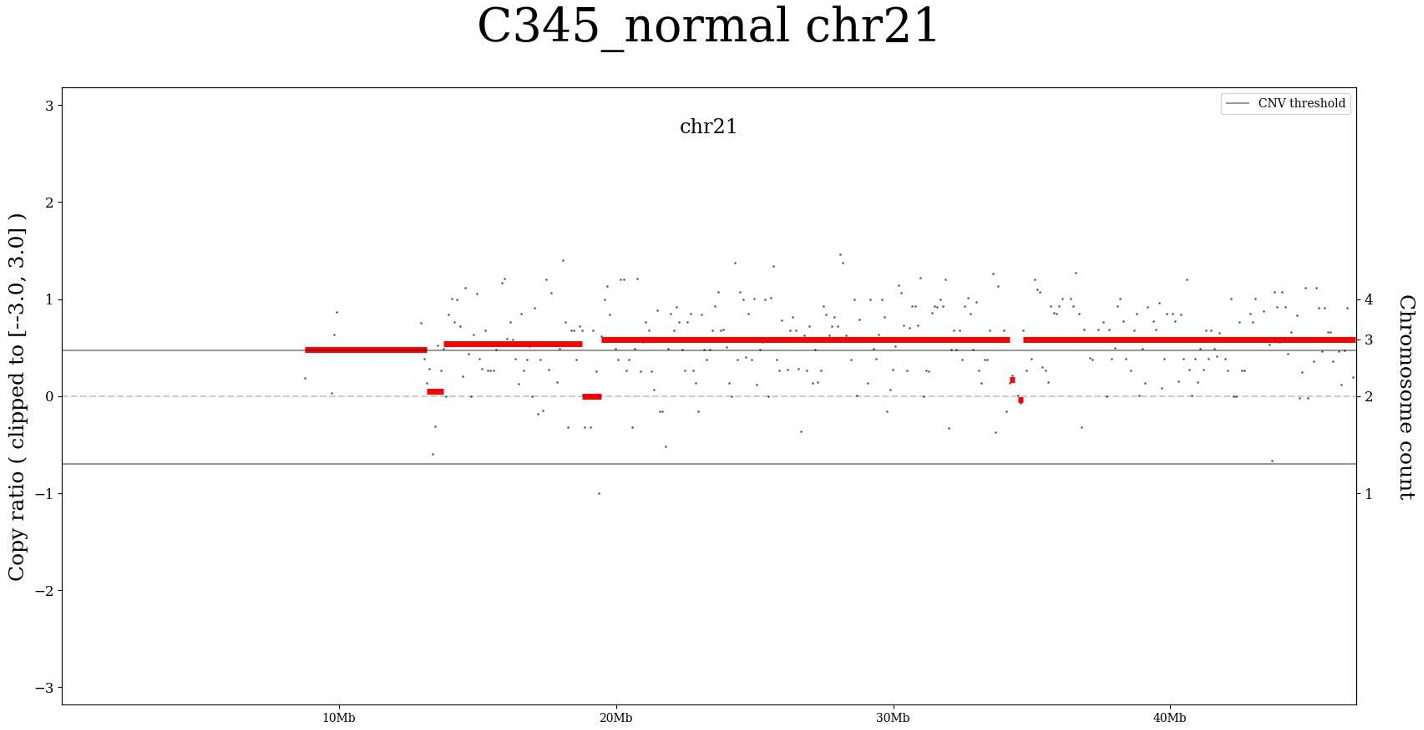
We can see the genomic intervals of the chromosome on a horizontal scale and the copy number in the chromosome on a vertical scale. On the given plot, we see that the copy number of chromosome 21 is increased several times for this sample.
- Karyogram-like graph with denoted chromosome-level CNVs in JPG format. To open the graph,
click on
. Graph example:
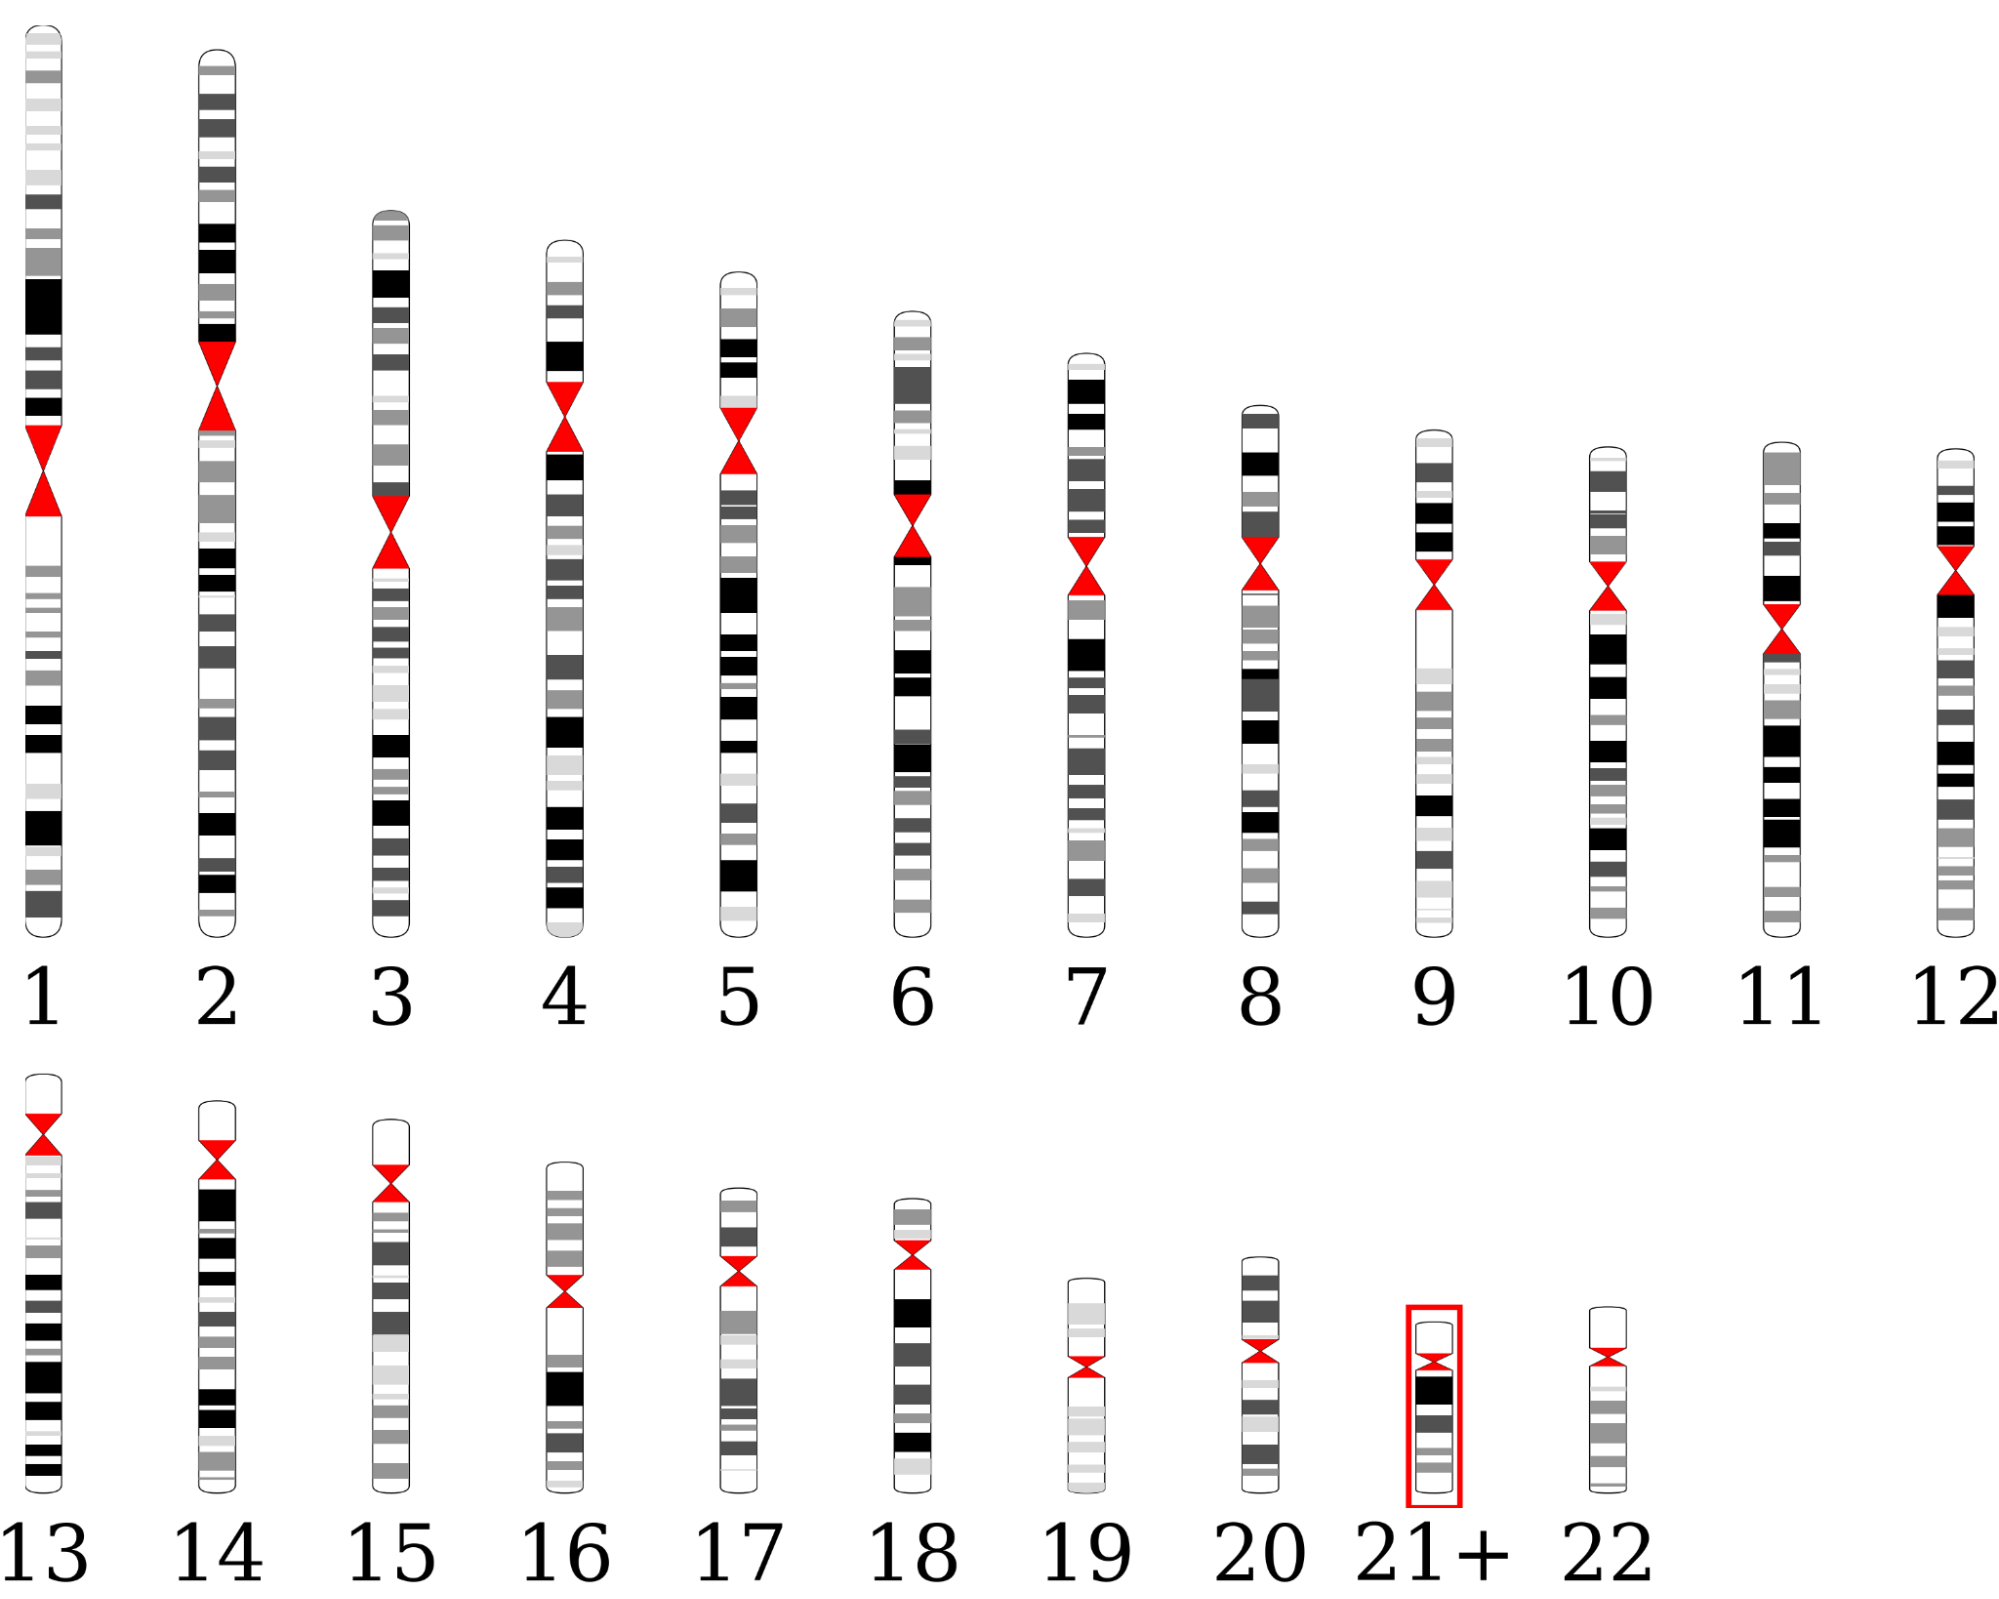
The karyogram indicates an increased number of copies of chromosome 21 in the sample.
- Integrative Genomics Viewer (IGV) is an embedded
module for visualization of variations on the genome. To open the module,
click on
. To see simultaneously two border regions of the certain region in IGV, click on
, and to return to the visualization of the entire region, click on
. If you would like to go to the position opened in IGV in Decipher genome browser, click on
.