Filtering of Variations
The needed copy number variations can be found by filtering. Filtering options are located above the table:

note
Table filtering is saved when you exit the CNV Viewer page.
1. Log2FC thresholds#
Variation filtering by log2FC thresholds - the logarithmic ratio of the detected copy number to the normal copy number. The available threshold values for this filter depend on the sample's chromosomal sex determined by CNVkit from the relative copy number of the autosomes and sex chromosomes.
If the chromosomal sex is determined as male (XY) or if sex cannot be determined, the available threshold values will be:
- Del: ≤-1, Dup: ≥0.58 (chrX: ≥1, chrY: ≥1) (XY)
- Del: ≤-0.9 (chrX: ≤-3.8, chrY: ≤-3.8), Dup: ≥0.55 (chrX: ≥0.94, chrY: ≥0.94) (XY)
- Del: ≤-0.8 (chrX: ≤-2.74, chrY: ≤-2.74), Dup: ≥0.51 (chrX: ≥0.88, chrY: ≥0.88) (XY)
- Del: ≤-0.7 (chrX: ≤-2.11, chrY: ≤-2.11), Dup: ≥0.46 (chrX: ≥0.82, chrY: ≥0.82) (XY) - default value
- Del: ≤-0.6 (chrX: ≤-1.64, chrY: ≤-1.64), Dup: ≥0.42 (chrX: ≥0.74, chrY: ≥0.74) (XY)
- Del: ≤-0.5 (chrX: ≤-1.27, chrY: ≤-1.27), Dup: ≥0.37 (chrX: ≥0.66, chrY: ≥0.66) (XY)
- Del: ≤-0.4 (chrX: ≤-0.95, chrY: ≤-0.95), Dup: ≥0.31 (chrX: ≥0.56, chrY: ≥0.56) (XY)
- Del: ≤-0.3 (chrX: ≤-0.67, chrY: ≤-0.67), Dup: ≥0.24 (chrX: ≥0.45, chrY: ≥0.45) (XY)
If the chromosomal sex is determined as female (XX), the available threshold values will be:
- Del: ≤-1 (chrX: ≤0), Dup: ≥0.58 (chrX: ≥1.58, chrY: ≥0) (XX)
- Del: ≤-0.9 (chrX: ≤0.1), Dup: ≥0.55 (chrX: ≥1.55, chrY: ≥-0.1) (XX)
- Del: ≤-0.8 (chrX: ≤0.2), Dup: ≥0.51 (chrX: ≥1.51, chrY: ≥-0.23) (XX)
- Del: ≤-0.7 (chrX: ≤0.3), Dup: ≥0.46 (chrX: ≥1.46, chrY: ≥-0.37) (XX) - default value
- Del: ≤-0.6 (chrX: ≤0.4), Dup: ≥0.42 (chrX: ≥1.42, chrY: ≥-0.55) (XX)
- Del: ≤-0.5 (chrX: ≤0.5), Dup: ≥0.37 (chrX: ≥1.37, chrY: ≥-0.77) (XX)
- Del: ≤-0.4 (chrX: ≤0.6), Dup: ≥0.31 (chrX: ≥1.31, chrY: ≥-1.04) (XX)
- Del: ≤-0.3 (chrX: ≤0.7), Dup: ≥0.24 (chrX: ≥1.24, chrY: ≥-1.41) (XX)
Filtering algorithm::
- Click on the filter field;
- Select the needed filtering option from the drop-down list, or type the option you are looking for in the search box and select from the found.
Done! Filter applied. The selected filter can be seen in the field:

When all filters are reset, the log2FC threshold filter reverts to its default value. This value can only be changed or cleared within the filter itself (see below for details).
Let’s take default value for XY (Del: ≤-0.7 (chrX: ≤-2.11, chrY: ≤-2.11), Dup: ≥0.46 (chrX: ≥0.82, chrY: ≥0.82)) as an example to explain how these filtering conditions work:
- Copy number variations on autosomes with log2FC ≤ -0.7 are considered deletions. -0.7 is the default log2FC threshold, below which only one autosome is called instead of the normal two.
- Copy number variations on the X and Y chromosomes with log2FC ≤ -2.11 are considered deletions.
- Copy number variations on autosomes with log2FC ≥ 0.46 are considered duplications. The threshold for duplication on an autosome is calculated using the following formula: log2FC = log2((2+D)/2), where D is the “number” of copy number that is “lost” at log2FC = -0.7, and 2 is the number of sister chromatids in the autosome.
- Copy number variations on the X and Y chromosomes with log2FC ≥ 0.82 are considered duplications.
- Variations that do not satisfy the thresholds, i.e. variations on autosomes with -0.7 < log2FC < 0.46 and variations on sex chromosomes with -2.11 < log2FC < 0.82 do not pass filtering, i.e. are excluded from the CNV Viewer table.
Calculation of log2FC thresholds for deletions and duplications on autosomes and sex chromosomes#
The threshold of calling a single copy instead of two on autosomes is calculated as
follows: T21 = log2(C/2), where C is the number of called
copies.
Delta of copy number: D = 2 – C = 2 – 2 × 2T21.
Then the corresponding threshold of calling three copies instead of two on autosomes is calculated as
follows: T23 = log2((2+D)/2) = log2(2-2T21).
Threshold of calling duplications on autosomes: hi = T23.
To calculate the threshold of calling three copies instead of two on the X chromosome, we normalize to XY genotype by dividing it by copy number of 1: T23X= log2((2+D)/1) = log2(2+2-2×2T21) = 1 + log2(2-2T21) = 1 + T23.
Calculating the threshold of calling duplications on the X chromosome:
- if there is no Y chromosome: Xhi = 1 + T23;
- if there is Y chromosome: Xhi = log2(3-2×2T21).
The threshold of calling one copy instead of two on the X chromosome: T21X = log2((2-D)/1) = log2(2-2+2×2T21) = 1 + T21.
Threshold of calling no copies instead of one on the X chromosome: T10X = log2((1-D)/1) = log2(1-2+2×2T21) = log2(-1+2×2T21).
Calculating the threshold of calling deletions on the X chromosome:
- if there is no Y chromosome: Xlo = 1 + T21;
- if there is Y chromosome: Xlo = log2(-1+2×2T21).
The threshold of calling one copy instead of none on the Y chromosome in the case of genotype XX: T01 = log2((0+D)/1) = log2(2-2×2T21) = log2(2×(1-2T21)) = 1 + log2(1-2T21).
Calculating the threshold of calling duplication Yhi and deletions Ylo on the Y chromosome:
- if there is no Y chromosome: Yhi = 1 + log2(1-2T21)); Ylo = -∞;
- if there is Y chromosome: Yhi = Xhi; Ylo = Xlo.
2. Region chr:start-end#
Filter variations by position. To filter, enter the position of the needed genomic interval, i.e. the corresponding chromosome and the start and end positions. Possible options of writing a position:
chr1:161,190,824-161,193,921chr1:161190824-161193921chr1:161190824_1611939211:161190824-161193921
You can also filter by more than one interval at once. For example,
by chr1:161190824-161193921, chrX:151110769-151113866.
The filtering result will be rows with variations whose positions intersect with the entered interval.
3. Gene panel#
Filtering variations by localization in certain genes from the panel. You can add a gene panel on "Gene Panels" page or import a panel from the Library of the most common clinical panels. To import, click on "Import from Library":

Select the required panels by ticking them in the window that opens:

and click on  to add panel.
4. Gene#
Filtering variations by localization in the gene transcript. The transcript is given in brackets next to the official gene name. You can filter variations by several genes at once. To do this, tick the required genes and click outside the value area:

If several transcripts are known for a gene, the list presents all of them:

5. Ontology#
Filter variations by their localization in genes associated with terms from the Human Phenotype Ontology (HPO) and the Mondo Disease Ontology (Mondo). Click the ontology filter field. The search dialog that opens displays the main phenotype groups in a drop-down list:

Methods for searching and selecting a phenotype or disease for filtering:
- Search directly in the drop-down list. You can navigate the phenotype groups using
the
 and
and  buttons
to expand and collapse the list of terms within each group, respectively:
buttons
to expand and collapse the list of terms within each group, respectively:
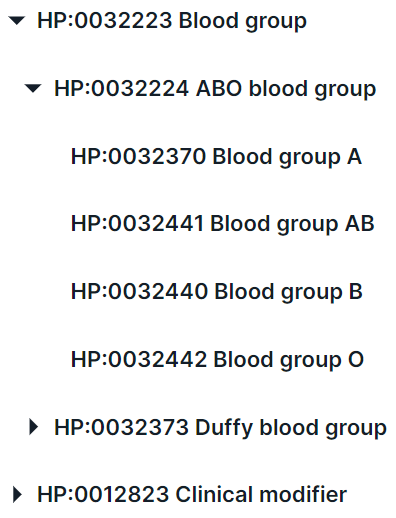
You can also search for a phenotype or disease:
- by its full or partial name;
- by its HPO ID (for example, HP:0009733 or 0009733);
- by its Mondo ID (for example, MONDO:0009733 or 0009733).
For example, searching for "glioma" returns several matching terms:
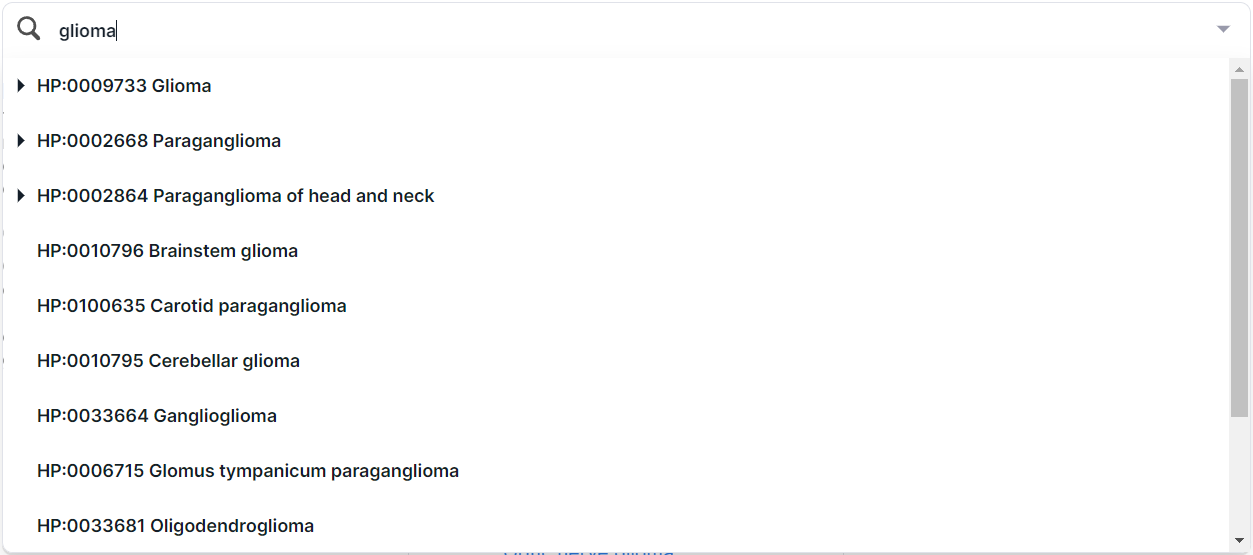
To select a term for filtering, click the corresponding row. You can filter by either an entire phenotype group or an individual phenotype. After selecting a phenotype (for example, Glioma), its information card is displayed:

The left side of the card displays the full phenotype or disease name with a link to the corresponding page in the HPO or Mondo ontology (provided by the Monarch Initiative), as well as all available information from the selected ontology, including the description, synonyms, comment, and PubMed references.
The center of the card displays the term hierarchy. Parent terms of the selected disease (in this example, Glioma) are shown above it, indicating the phenotype groups to which it belongs. Child terms (phenotypes and diseases that belong to the Glioma group) are displayed below.
The right side of the card contains a list of genes associated with the selected phenotype or disease.
Above the phenotype card, the terms selected for filtering are displayed together with their ontology
identifiers. The number of genes associated with each term is shown in parentheses. To open a phenotype
card, click the corresponding term. To remove a term from the filter,
click the  button:

Search using the term hierarchy. The phenotype card allows you to navigate through the ontology hierarchy. Click the name of a parent or child phenotype to open its card.
If the term has not yet been selected for filtering and associated genes are available, click to add it to the variation filter.
Search in multi-select mode. Click the right button of the search mode switcher in the upper-left corner of the dialog:
 . A list of the
main phenotype groups with selection checkboxes is displayed.
. A list of the
main phenotype groups with selection checkboxes is displayed.

Search can be performed:
- by full or partial name;
- by HPO ID (for example, HP:0009733 or 0009733);
- by Mondo ID (for example, MONDO:0009733 or 0009733).
For example, searching for "glioma" returns several matching terms:
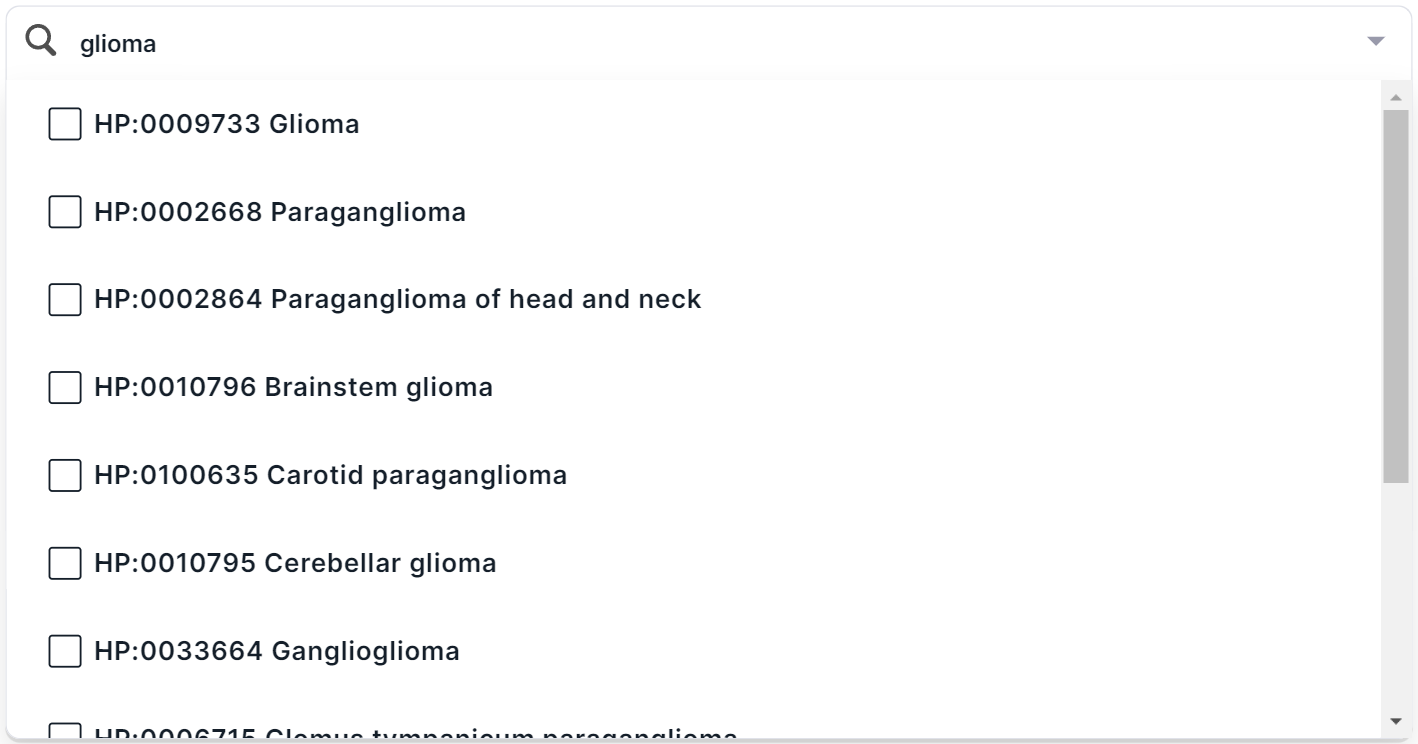
In multi-select mode, you can select multiple terms simultaneously from the drop-down list. To include a phenotype in the filter, select its corresponding checkbox.
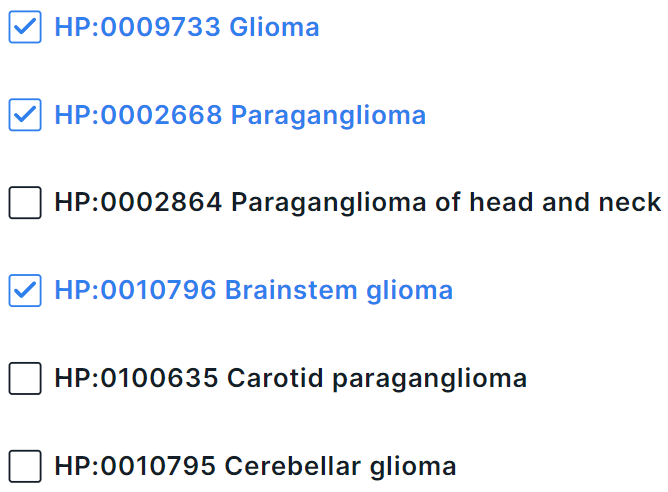
When you have finished selecting phenotypes, click anywhere outside the drop-down list but within the
search dialog. The selected filter terms are displayed at the top of the dialog. The number of genes
associated with each phenotype is shown in parentheses. Click a phenotype to open its information card.
To remove a phenotype, click the button.

To filter variations by genes associated with the selected phenotypes,
click  .
To view the list of selected terms, hover over the ontology filter field:
.
To view the list of selected terms, hover over the ontology filter field:

To clear filtering for all selected terms, hover over the ontology filter field and click the cross icon that appears:

Alternatively, click the ontology filter field and modify the selection in the phenotype search dialog.
6. Type#
Filter variations by the copy number variation type: LOSS - deletion, GAIN - duplication.
7. CDS Overlap#
Filter variations by overlapping with CoDing Sequence (CDS):
- Overlapped CDS - the variation affects the CDS (percentage of overlapped CDS is greater than 0);
- Not overlapped CDS - the variation does not affect the CDS (percentage of overlapped CDS equals 0).
8. ACMG Class#
Filter variations by pathogenicity assigned according to the ranking score defined by AnnotSV:
- Pathogenic;
- Likely pathogenic;
- Uncertain significance conflict - conflicting interpretations of pathogenicity;
- Uncertain significance;
- Likely benign;
- Benign;
- Undefined.
You can filter variations by several pathogenicity values at once. To do this, tick the required values and click outside the value area.
9. Cohort 180 AF#
Filter variations by frequency in a cohort of 188 normal samples. AF values are only available for germline CNVs discovered in WGS or low-pass WGS samples normalized to the "BGI WGS" reference samples panel with bin size 3000 or 5000 or the "BGI WGS v2" reference samples panel with bin size 3000. The filter is only displayed in the CNV Viewer with copy number variations discovered in the bins.
Possible values:
- <0.05 or empty;
- <0.02 or empty;
- <0.01 or empty;
- <0.005 or empty;
- <0.0001 or empty.
Reset Filters#
To reset all applied filters, click on  .
Only filtering by default log2FC threshold
value - Del: ≤-0.7 (chrX: ≤-2.11, chrY: ≤-2.11), Dup: ≥0.46 (chrX: ≥0.82, chrY: ≥0.82) will be preserved.
.
Only filtering by default log2FC threshold
value - Del: ≤-0.7 (chrX: ≤-2.11, chrY: ≤-2.11), Dup: ≥0.46 (chrX: ≥0.82, chrY: ≥0.82) will be preserved.
To clear a separate filter:
- Click on the filter field and then on
 .
. - To clear filtering by region, hover over the filter field and click on the cross:

- For a filter by gene, you can remove one of the selected filtering options. To do this, click on the filter field and uncheck the option.
- To change the selected phenotypes used for variation filtering, click the ontology filter field and modify the selection in the phenotype search dialog. To clear filtering for all selected terms, hover over the ontology filter field and click the cross icon that appears: