CNV Viewer
Overview#
CNV Viewer is an embedded service for viewing and analyzing copy number variations (CNVs) discovered in the sample. Available on the main page of the sample (Main tab) if its “Copy number variations discovery” stage has been successfully completed.
On the non-tumor sample page, you can find a CNV Viewer with germline copy number variations discovered in this sample:

On the tumor sample page from a pair of tumor/control samples, you can find two CNV Viewers: one with somatic copy number variations discovered in this sample and one with germline copy number variations discovered in the control sample:
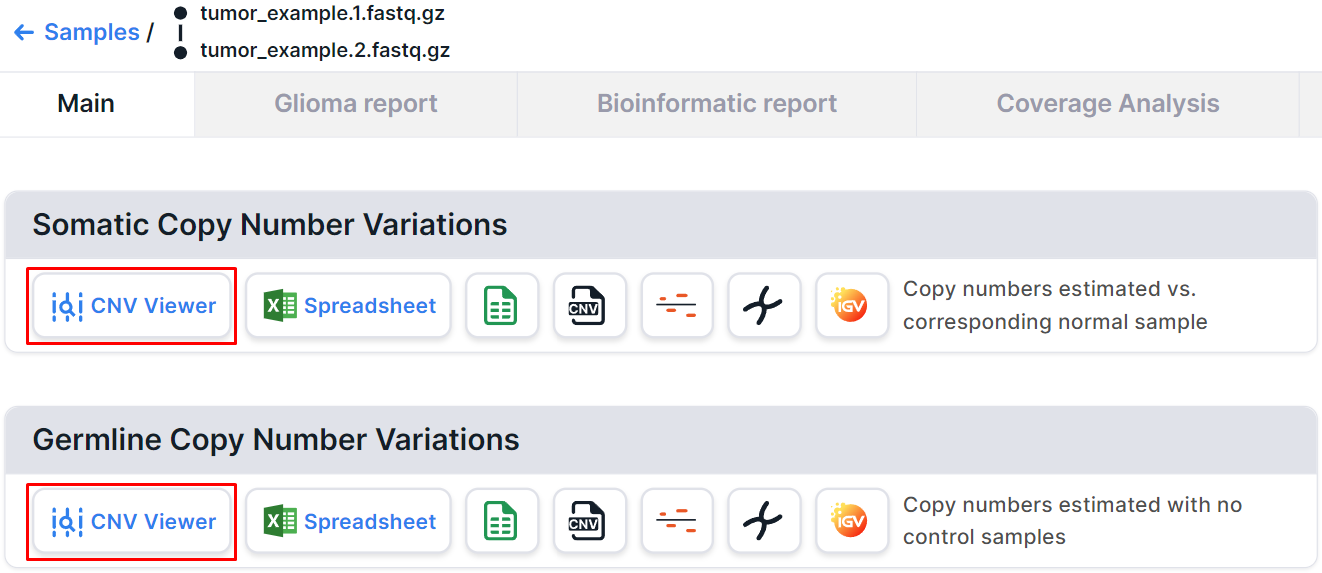
On the tumor sample page analyzed without a control sample, you can find a CNV Viewer with somatic and germline copy number variations discovered in this sample:

Segments and Bins#
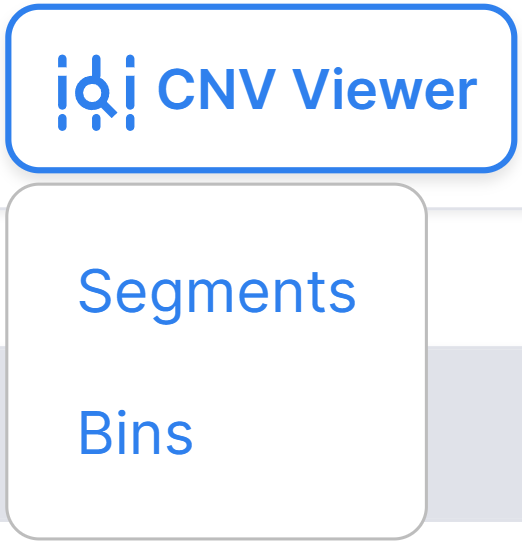
By clicking on the button  , you will
see two options: “Segments” and “Bins”, which open CNV Viewer with copy number variations discovered
in the segments or bins, respectively:
info
Segments and bins are intervals in which the read counts are estimated.
Bins are small intervals, the size of which is controlled
by the corresponding setting for WGS,
and which are created by dividing the reference genome into equal-sized intervals. The bin size determines
the resolution of copy number variations discovery.
Segments are large regions of the genome that are obtained by combining adjacent bins with similar
copy number.
The bins provide a fine-grained genome-wide copy number signal without loss of information and some noise.
Segmentation attempts to remove the noise and infer the location of discrete copy number variations, i.e.
the individual regions that have been duplicated or deleted.
Therefore, it is recommended to analyze segments first, and continue by analyzing bins to show the level of
support for each segment, as well as to find potential artifacts, such as particularly noisy regions of the genome.
However, it is worth considering that some outlier bins that are rejected by segmentation as noise may turn
out to be real copy number variations, equal in size to these bins.
Main Page#
By selecting one of the button  options:
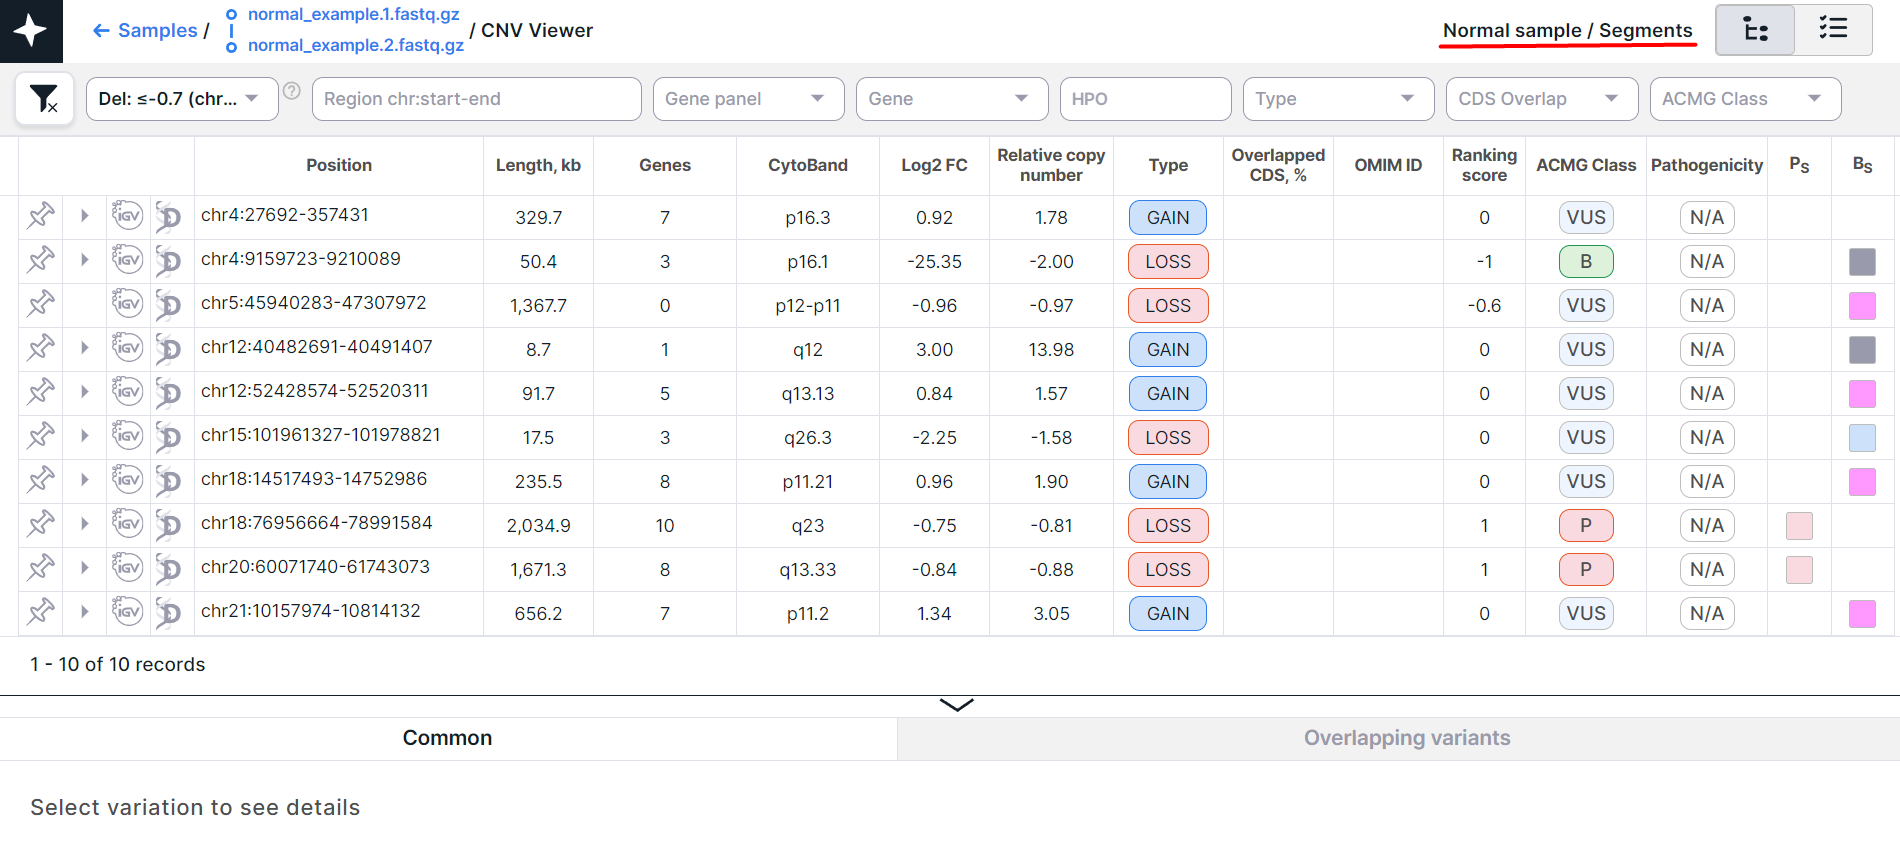
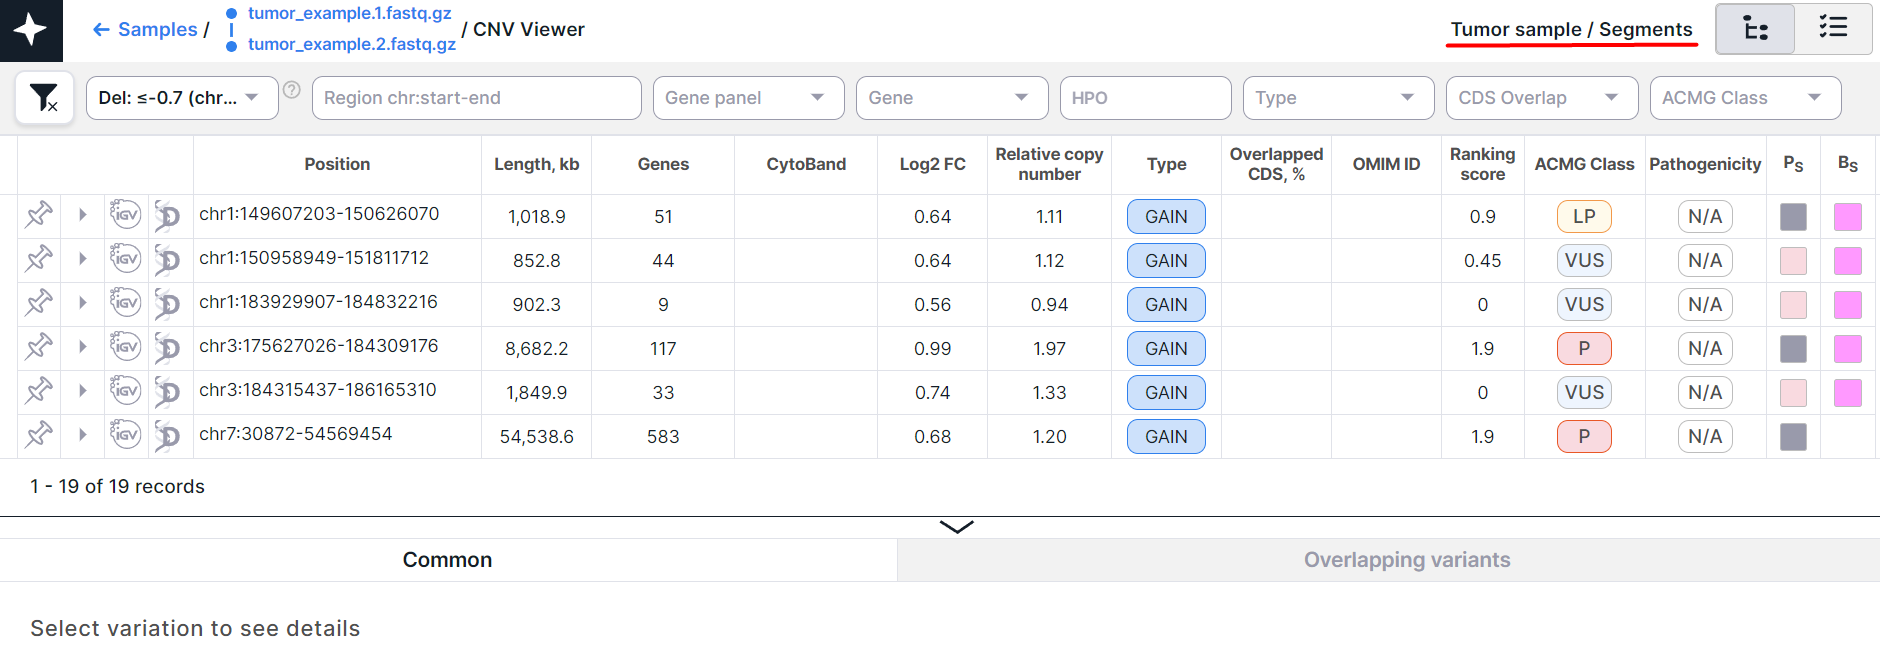
“Segments” or “Bins”, you will see the main CNV Viewer page with copy number variations discovered in
segments or bins, respectively. At the top right of the page, you can find out CNV Viewer with which
variations is open:
- CNV Viewer with copy number variations discovered in segments of a non-tumor tissue sample:
- CNV Viewer with copy number variations discovered in bins of a non-tumor tissue sample:

- CNV Viewer with copy number variations discovered in segments of a tumor tissue sample:
- CNV Viewer with copy number variations discovered in bins of a tumor tissue sample:

The main object of CNV Viewer is a table with copy number variations. Each variation is on a new row:

Below the table, above the variation details panel, there are:
- Information about the amount of variations in CNV Viewer: the order of variations displayed on the page (e.g., if the maximum amount of variations shown on the page is 50, then the order will be: 1-50, 51-100, etc.) and the total amount of variations (pinned variations are not taken into account). The amount of variations changes when filtering variations and displays the amount of variations that match the specified conditions. In tree mode, the amount of full rows is displayed. If one of the full rows has been expanded in tree mode, the amount of split rows corresponding to this full row is shown. In flat list mode, the amount of both full and split rows is displayed.
- A component to choose the amount of variations displayed on the page
(excluding pinned variations):
. By default, 50 variations are displayed per page. To change the amount of variations displayed on the page to 20, 100 or 200, click on the corresponding option. Your choice will be remembered and will be valid for CNV Viewer and SNV Viewer of all samples. Please note that the more variations shown on a page, the longer it will take to load the page.
- Pagination component:
, which allows you to navigate between pages with variations. The number of the current page is highlighted in a blue circle. If you click on this number, the page will reload. To move to a page with a specific number, either click on that number, or click on
, enter the number and press the enter key or click outside the value field. To move to the page with previous number, click on
, and to open the next page, click on
.
Full and Split Rows#
There are two modes of CNV annotation: annotation on the variation full length (“full”) and annotation on each gene overlapped by the variation (“split”). Each full record can correspond to several split records. Full records are displayed in CNV Viewer as parent rows, and split records are displayed as their child rows. The appearance of the rows depends on the CNV Viewer table presentation mode.
CNV Viewer Modes#
There are two modes for CNV Viewer table
presentation: tree mode
and flat list mode. Mode can be changed by
toggle in the upper right corner of CNV Viewer: .
note
The selected mode and the expansion of the full row in tree mode (see below) are saved when you exit the CNV Viewer page.
Tree Mode#
By default, CNV Viewer opens in tree mode. The table loads faster with this mode, since split rows are not shown along with full rows in it:

The full row can be expanded to see the corresponding split rows in that position by
clicking on in the full
variation row. If a row does not have any corresponding split records, it does not have such button.
The expanded full row and its split rows looks like this:

Here the first row is full, and below there are the corresponding split rows. To return to the table with
all full rows without split ones, click on
in the full variation row.
To switch to tree mode from flat list mode,
click on the toggle button at the top of the page.
Flat List Mode#
To switch to flat list mode from tree mode,
click on the toggle button at the top
of the page. CNV Viewer works slower in this mode, since it displays not only full rows, but also split rows.
In this mode, full rows are colored gray, and split rows are colored
white and are written under the corresponding full row:
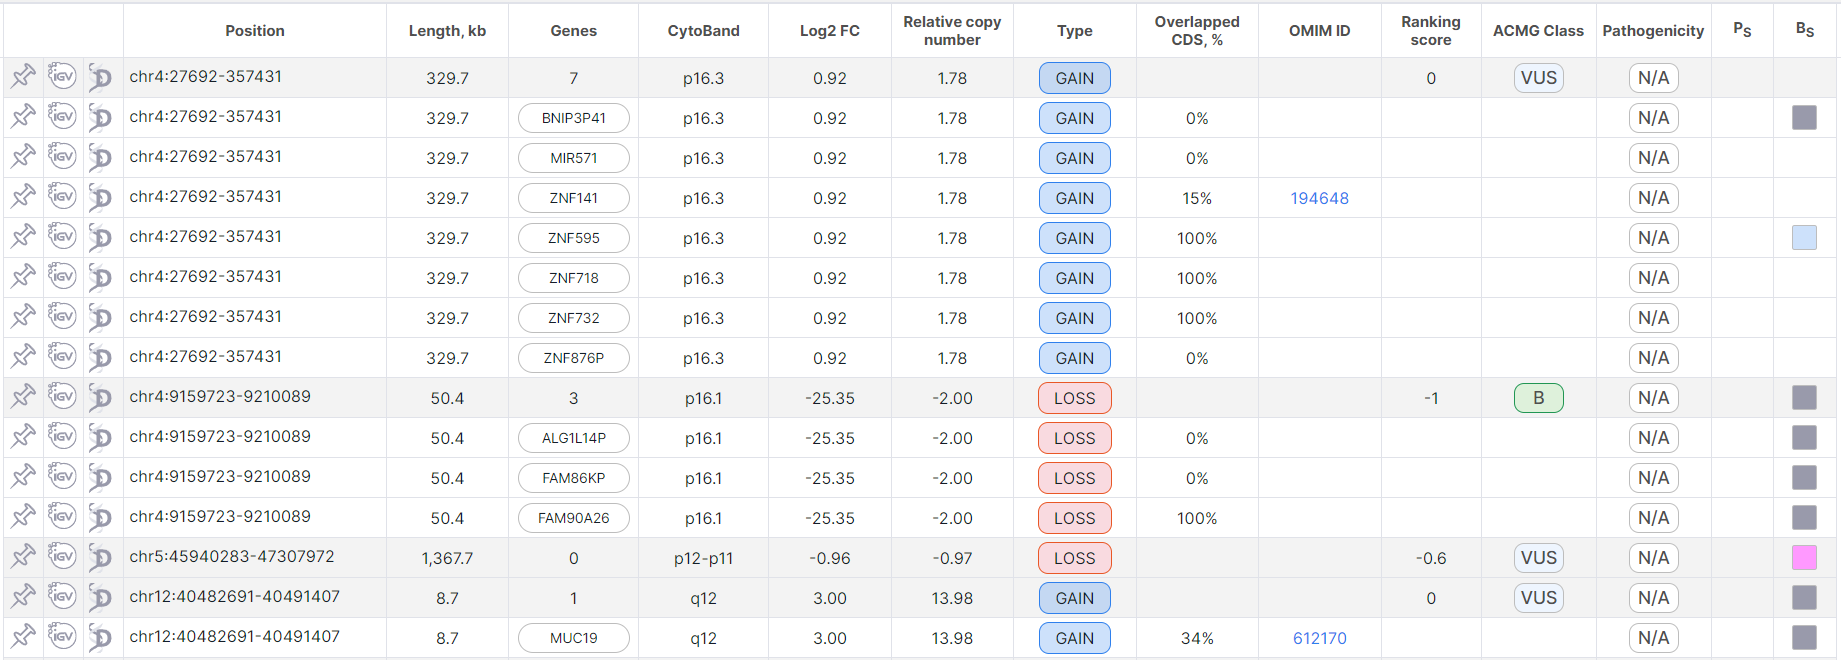
Pin Variation#
You can pin the required variations. Pinned variations are not affected by filtering and sorting the variation table, they always remain at the top of the table. The pinned variations are sorted by position.
To pin a variation, click on in the variation row.
In tree mode, the pinned full row will appear at the top of the table above the other unpinned full rows (the row is colored green):

When a split row is pinned, the corresponding full row is also automatically pinned. At the same time, the full row remains at the top of the table (it remains white), and the pinned split row moves above the rest of the unpinned split rows. The pinned split rows are sorted by gene name.

In flat list mode, a pinned full row also moves to the top of the table (the row is colored green).
Moreover, if a full row has corresponding split records, then its row is duplicated in the table above
the corresponding split rows (the duplicate row is colored gray like the other full rows, and the pin button
looks like ).
When you click either on pinned or duplicate row, both rows will be colored blue.

When a split row is pinned, the corresponding full row is also automatically pinned. Both rows are moved to the top of the table and colored green. If this full row still has unpinned corresponding split rows, then it is duplicated in the table, as described above. If all split rows of the full row are pinned, then a duplicate row is not created.

To unpin a variation, click on the button in the variation row (or on
in the duplicate full row).
note
The variation remains pinned when you exit the CNV Viewer page.
Variation Info#
In addition to the information presented in the table (see Table Columns' Description), for each variation there are several embedded modules with additional information:
- Variation detailed information panel. To see the panel, click on the variation row:

info
By default, the panel is expanded at the bottom of the CNV Viewer table. If you do not use the panel on a regular basis, you can hide it from CNV Viewer on the "Profile settings" page.
You can read more about the panel and its tabs in the corresponding section.
- Integrative Genomics Viewer (IGV) is a module for visualization of variation on the genome.
Click on
in the variation row to open the module. To see simultaneously two border regions of the quite large variation in IGV, click on
, and to return to the visualization of the entire variation, click on
. If you would like to go to the position opened in IGV in Decipher genome browser, click on
. From IGV opened from CNV Viewer, you can return back to CNV Viewer with a filter by the position opened in IGV by clicking on the button
.
- Link to variation position in Decipher genome browser. To open
the browser, click on
in the variation row.
Table Columns' Description#
The CNV Viewer table can include the following columns:
- Position is a coordinate of the variation in the genome (chromosome + start position + end position).
You can copy the variation position to the clipboard by moving the cursor over the column value and
clicking on
.
- Length, kb is a length of the copy number variation region in kilobases.
- Genes. For full rows, this is the number of genes located in the affected region of copy number variation.
For split rows, this is the name of the gene located in the region.
You can copy the gene name to the clipboard by moving the cursor over the column value and
clicking on
.
- CytoBand is a shorthand notation for the CNV position on a chromosome. This position is indicated relative to bands (regions of chromosomes that are clearly different from neighboring ones) that are formed on chromosomes by differential staining methods. A region is a section of a chromosome arm between the two closest marker bands (the most noticeable and clear light or dark bands). Sub-bands are sections of chromosomes resulting from the division of bands when analyzing chromosomes with high resolution. Sub-bands can also be divided into parts. The nomenclature of the CNV locus is as follows: chromosome arm (p-arm, i.e. shorter arm, or q-arm, i.e. longer arm), region, band, sub-band (can also be divided into parts). For example, the “p.36.33” locus means that the variation is located in the 3rd part of the 3rd sub-band of the 6th band of the 3rd region of the p-arm of the chromosome.
- Log2 FC is the logarithmic ratio of the detected copy number to the normal copy number (equals to 2 for autosomes and the X chromosome in the case of genotype XX, or to 1 for sex chromosomes in the case of genotype XY).
- Relative copy number is the number of copies of a certain region per haploid genome.
- Type is a copy number variation
type:
- deletion,
- duplication.
- Overlapped CDS, % is a share of the length of the CoDing Sequence (CDS) overlapped with the variation (in percent). Provided for split rows only.
- Cohort 180 AF is the variation frequency in a cohort of 188 normal samples. AF values are only available for germline CNVs discovered in WGS or low-pass WGS samples normalized to the "BGI WGS" reference samples panel with bin size 3000 or 5000 or the "BGI WGS v2" reference samples panel with bin size 3000. The column is only displayed in the CNV Viewer with copy number variations discovered in the bins. The column cells are colored depending on the AF value:
- green if AF ≥ 0.015;
- yellow if 0.01 ≤ AF < 0.015;
- red if AF < 0.01.
- OMIM ID is an ID from OMIM database of the gene located in the affected region of variation. Available only for split rows.
- Ranking score is the classification of variation pathogenicity provided by AnnotSV and based on ACMG and ClinGen recommendations1. According to the ranking score, the ACMG class is assigned:
- Variations with a ranking score ≥ 0.99 are assigned class 5 - pathogenic;
- Variations with a ranking score from 0.90 to 0.98 are assigned class 4 - likely pathogenic;
- Variations with a ranking score from 0.89 to −0.89 are assigned class 3 - uncertain significance;
- Variations with a ranking score from −0.90 to −0.98 are assigned class 2 - likely benign;
- Variations with a ranking score ≤ −0.99 are assigned class 1 - benign.
- ACMG Class is the variation pathogenicity assigned according to the ranking score defined
by AnnotSV (see conditions above).
Column values are presented
as icons:
- Pathogenic;
- Likely pathogenic;
- Uncertain significance;
- Likely benign;
- Benign.
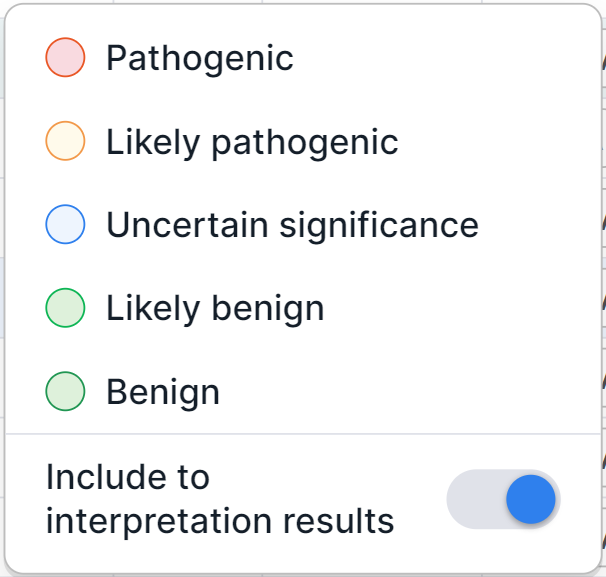
You can see the full value by hovering over the icon. - Pathogenicity is the variation pathogenicity determined by the user. To determine the pathogenicity
of a variation, click on the pathogenicity button
in the variation row and select the required option in the dialog that appears:
info
All variations with determined pathogenicity are automatically added to the sample interpretation results. If you want to exclude a variant with a determined pathogenicity from the interpretation results, disable the option "Include to interpretation results" in the dialog.
Possible column values are presented
as icons: - No interpretation (before determining the variation pathogenicity);
- Pathogenic;
- Likely pathogenic;
- Uncertain significance;
- Likely benign;
-
Benign.
You can see the full value by hovering over the icon.
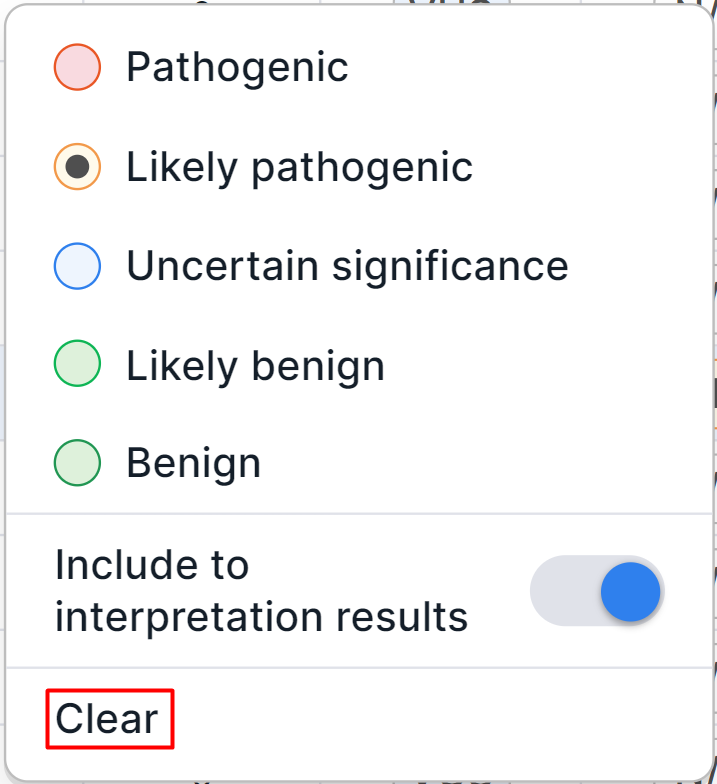
Pathogenicity can be overdetermined in the same dialog or cleared by clicking on the pathogenicity button in
the variation row and selecting the "Clear" option in the dialog that appears:
When reprocessing the copy number variations discovery stage or previous stages of sample analysis,
the determined pathogenicity class of the variation remains, but requires confirmation.
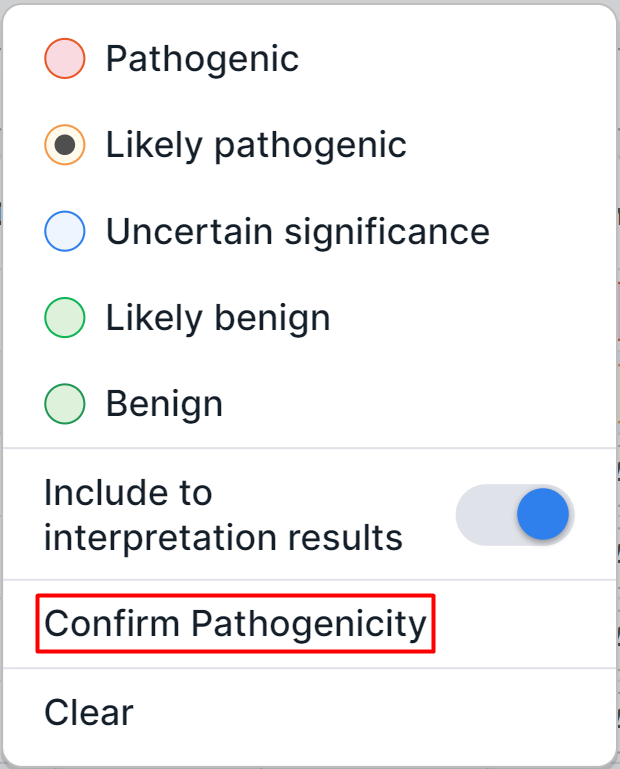
The button of pathogenicity that needs to be confirmed is
indicated by . If you agree with the determination
of the variation pathogenicity, click on the bell or pathogenicity button and select the
“Confirm Pathogenicity” option in the dialog that appears:
- Ps are pathogenic overlapping variants, i.e. known pathogenic genes or genomic regions completely overlapped with the variation. Column values are presented as icons:
- Gain;
- Loss;
- Insertion or mixed value.
You can see the full value by hovering over the icon. - Bs are benign overlapping variants, i.e. known benign genes or genomic regions completely overlapped with the variation. Column values are presented as icons:
- Gain;
- Loss;
- Inversion;
- Insertion or mixed value.
You can see the full value by hovering over the icon.
Filter and Sort Variations#
Filtering of variations in CNV Viewer is described in the corresponding section.
By default, the table is sorted by variation position. The table can be sorted by ascending or descending values of the following columns: “Position”, “Length, kb”, “Genes” (in tree mode, full rows are sorted by the number of genes and split rows are sorted by gene name, and in flat list mode, only full rows are sorted by the number of genes, and the sorting of split rows remains unchanged), "CytoBand", "Log2 FC", "Relative copy number", "Type", "Overlapped CDS, %", "Cohort 180 AF", "OMIM ID" (only in tree mode for split rows), "Ranking score", "ACMG Class", "Pathogenicity".
To sort a table by column values, click on the column name (click once to sort ascending, or twice to sort
descending). After this, an up arrow (when sorting in ascending order) or down arrow
(when sorting
in descending order) will appear next to the column name.
You can sort a table by 1-3 columns at a time to group data with the same values in one column, and then sort those groups with the same values in another column. The sorting order will depend on the order in which you click on the names of the corresponding columns. The sorting arrow will be next to the column by which you sorted last.
note
Table sorting and filtering are saved when you exit the CNV Viewer page.
To reset sorting, use the clear all filters
button: . Please note that this will
also reset variation filtering.
The main principle of sorting is sorting alphabetically for columns with text values (e.g. the "Type" column) or sorting from minimum to maximum and vice versa for columns with numeric values (e.g. the "Length, kb" column). However, for some columns the sorting is special:
- The values of the "Position" column are sorted first by chromosome, then by position on it.
- The values of the "ACMG Class" and "Pathogenicity" columns are sorted from pathogenic to benign variations: Pathogenic, Likely pathogenic, Uncertain significance, Likely benign, Benign.
- Riggs E.R., Andersen E.F., Cherry A.M. et al. Technical standards for the interpretation and reporting of constitutional copy number variants: a joint consensus recommendation of the American College of Medical Genetics and Genomics (ACMG) and the Clinical Genome Resource (ClinGen). Genet Med 22, 245-257 (2020)↩