Variant Details Panel
Click on the variant row to see a variant details panel under the table:
The panel can be resized by hovering over the top border of the panel and dragging down or up.
You can also collapse or expand the panel by
clicking on ![]() or
or ![]() , respectively.
, respectively.
info
On "Profile settings" page, you can adjust whether the variant details panel is expanded or collapsed in SNV Viewer by default.
Details Panel Tabs#
The panel is divided into 13 tabs (or 12 if there are no custom annotations in the system):
- Common
- Gene
- Phenotypes
- ClinVar
- gnomAD 3
- gnomAD 4
- ExAC
- Other frequencies
- Conservation
- Protein function effect
- Protein function effect (additional)
- Other
- Custom annotation sources (if at least one custom annotation was added to the system before the variants in the sample were annotated)
On the panel, only those tabs are visually highlighted that include at least one non-empty variant annotation
field. For example, "ClinVar" tab filled with data looks
like this:  , and empty - like this:
  .
.
You can navigate through the panel tabs using keyboard shortcuts. The navigation will be carried out only through non-empty tabs of the panel.
Available keyboard shortcuts
| Press this key | To do this |
| D or ➡️ | Move to the next tab that has at least one non-empty variant annotation field |
| A or ⬅️ | Move to the previous tab that has at least one non-empty variant annotation field |
As you move between variants in the table, the selected panel tab is retained.
Common#
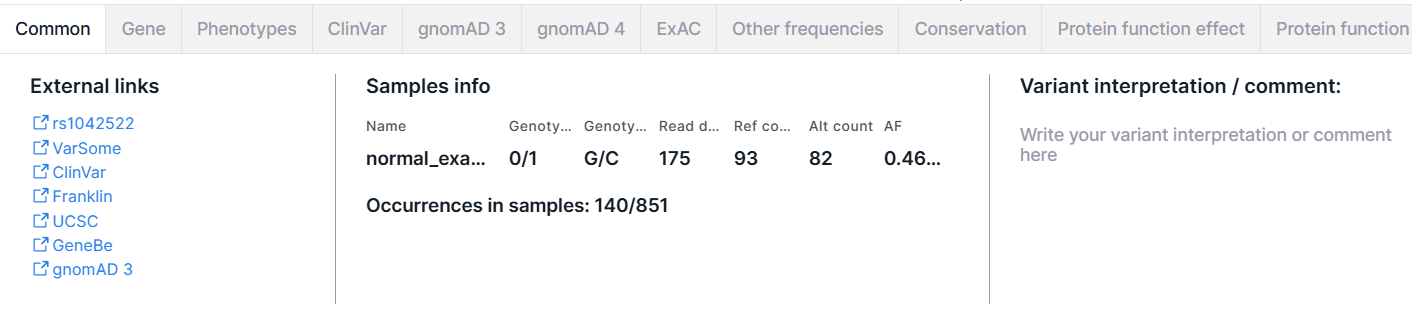
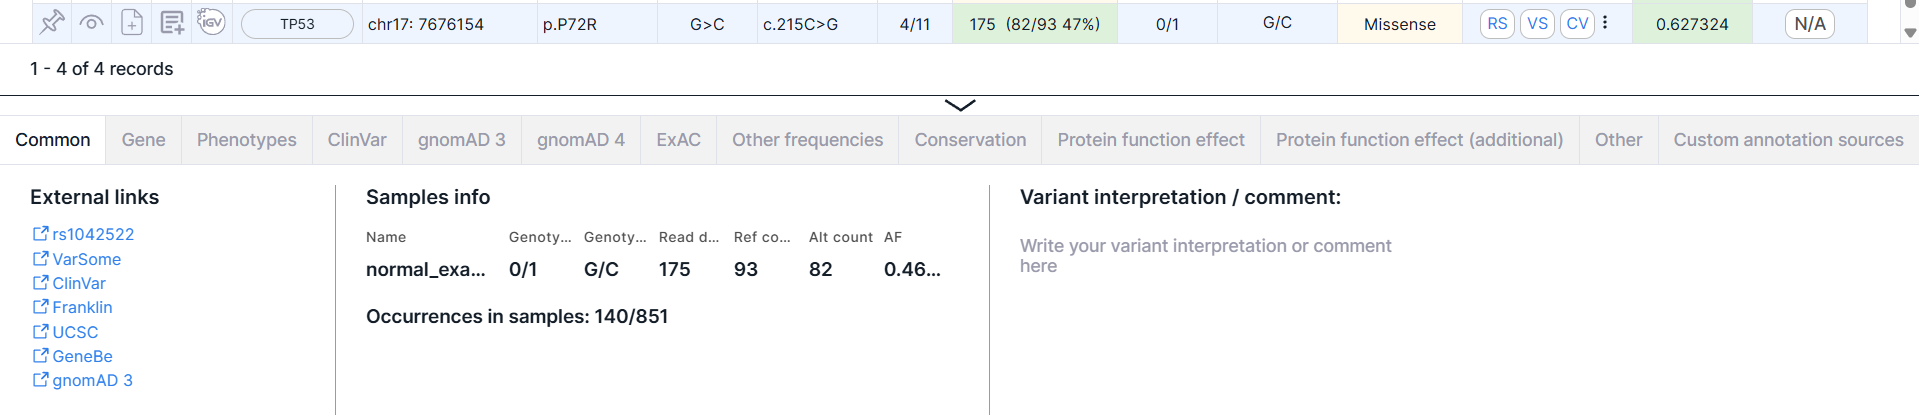
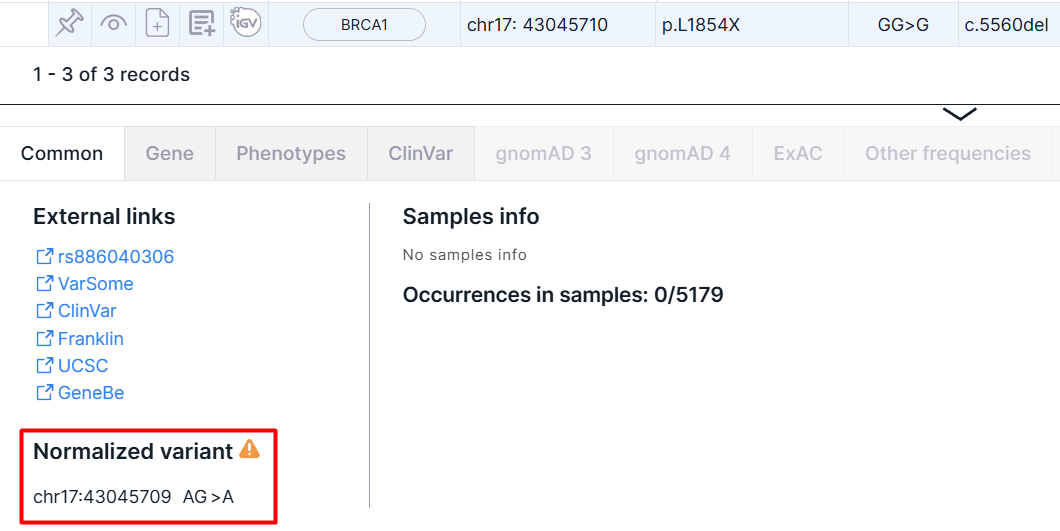
The tab contains basic information about the variant: external links, samples' info and variant interpretation. There may also be information about the normalized variant and the phasing group.
External Links#
Links to pages with variant information in dbSNP (rsId), VarSome, ClinVar, COSMIC (if the database was uploaded as a custom annotation), Franklin, UCSC, gnomAD 3, RUSeq (if the database was uploaded as a custom annotation).
Samples Info#
- Table with samples with the following columns:
- Name is a name of the sample, for which the analysis was performed.
- Genotype is an allele combination for this sample (0 - reference allele, 1 - first alternative allele, 2 - second alternative allele etc.), divided by ”/” (for unphased genotype) or “|” (for phased genotype). The number of alleles suggests ploidy of the sample.
- Read depth is a total number of reads of the sequence overlapping the variant position for this sample.
- Ref count is a reference allele reads count for this sample.
- Alt count is an alternative allele reads count for this sample.
- AF is an allelic frequency for this sample.
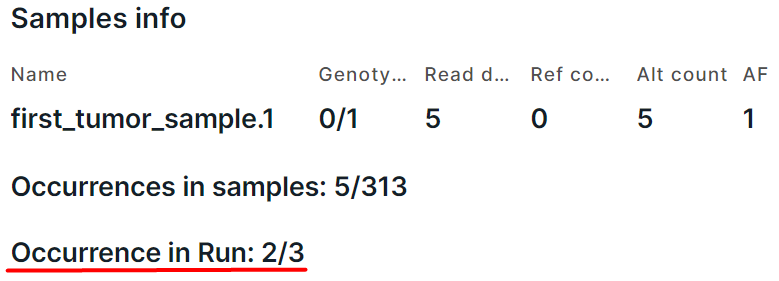
- Information about the variant occurrences in other samples uploaded into the system: number of variant/number of samples. Here is the number of variants that completely coincide with the variant in terms of origin (somatic or germline), chromosome, start position, reference and alternative allele and gene. These variants contain at least one alternative allele (i.e. have genotype 1/1, 1|1, 0/1, 1/0, 0|1, 1|0, 1/., 1|., ./1, .|1, 1, 0/0/1, 0 /2, 1/2, etc.) These variants are searched among all samples uploaded into the system (including deleted ones), for which the stage of variant discovery (or annotation for samples uploaded in VCF format) has been successfully completed. To calculate the occurrences of the somatic variant, those samples are taken into account in which the stage "Somatic SNVs/Indels discovery" (or "Somatic SNVs/Indels annotation" stage for VCF samples) has been successfully completed. To calculate the occurrences of the germline variant, samples with a successfully completed stage "Germline SNVs/Indels discovery" (or "Germline SNVs/Indels annotation" for VCF samples) are taken into account. By clicking on the link, you will see "Occurrences" tab of the variant details page.
- Information about the variant occurrence in run samples. Only presented on the variant panel in run SNV Viewer and run sample SNV Viewer. For example, in the following case, a variant was discovered in two of the three run samples:
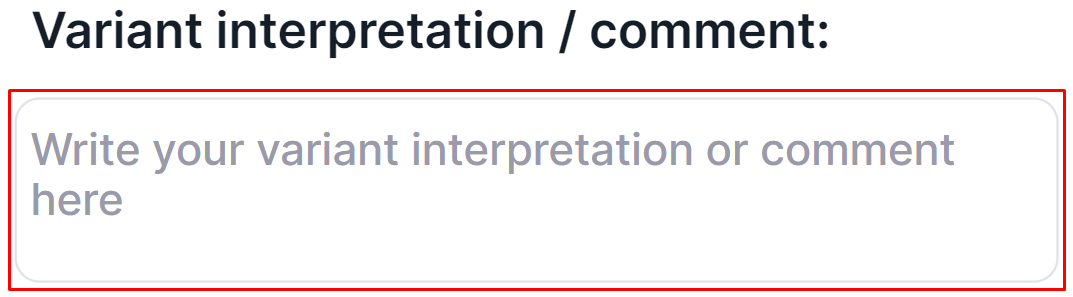
Variant Interpretation / Comment#
A variant interpretation is a comment with important information about the variant added by the user. Where to find it after adding is described here. To add or edit a variant interpretation, click on the input box, enter the text and click outside the input box to save the interpretation:
The author of the added interpretation (the name of the user who interpreted the variant) will be displayed in brackets next to the section name:

Normalized Variant#
Start position, reference allele, or alternative allele of some variants in the uploaded VCF file may not be left-normalized. In this case, the variant will be written in SNV Viewer table in the same form as in the original VCF file, and the normalized data will be shown on the details panel:
Phasing Group Info#
Phasing group is a merging of homozygous variants located within a specific genomic interval (window of size N, which can be changed as described here). In addition, the phasing group is merged in such a way that at least one variant from the group has an effect on the protein-coding part of at least one gene.
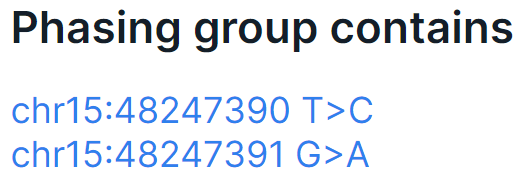
The phasing group details panel shows the variants that the group contains (you can open the variant details pages by clicking on the links):
The details panel of a variant included in the phasing groups shows these groups (you can open the phasing group details pages by clicking on the links):

If a variant is a part of phasing group with discordant amino acid substitutions, then that variant is
marked with ![]() . If the variant is a
part of phasing group with concordant amino acid substitution, then the variant is not marked with such icon.
. If the variant is a
part of phasing group with concordant amino acid substitution, then the variant is not marked with such icon.
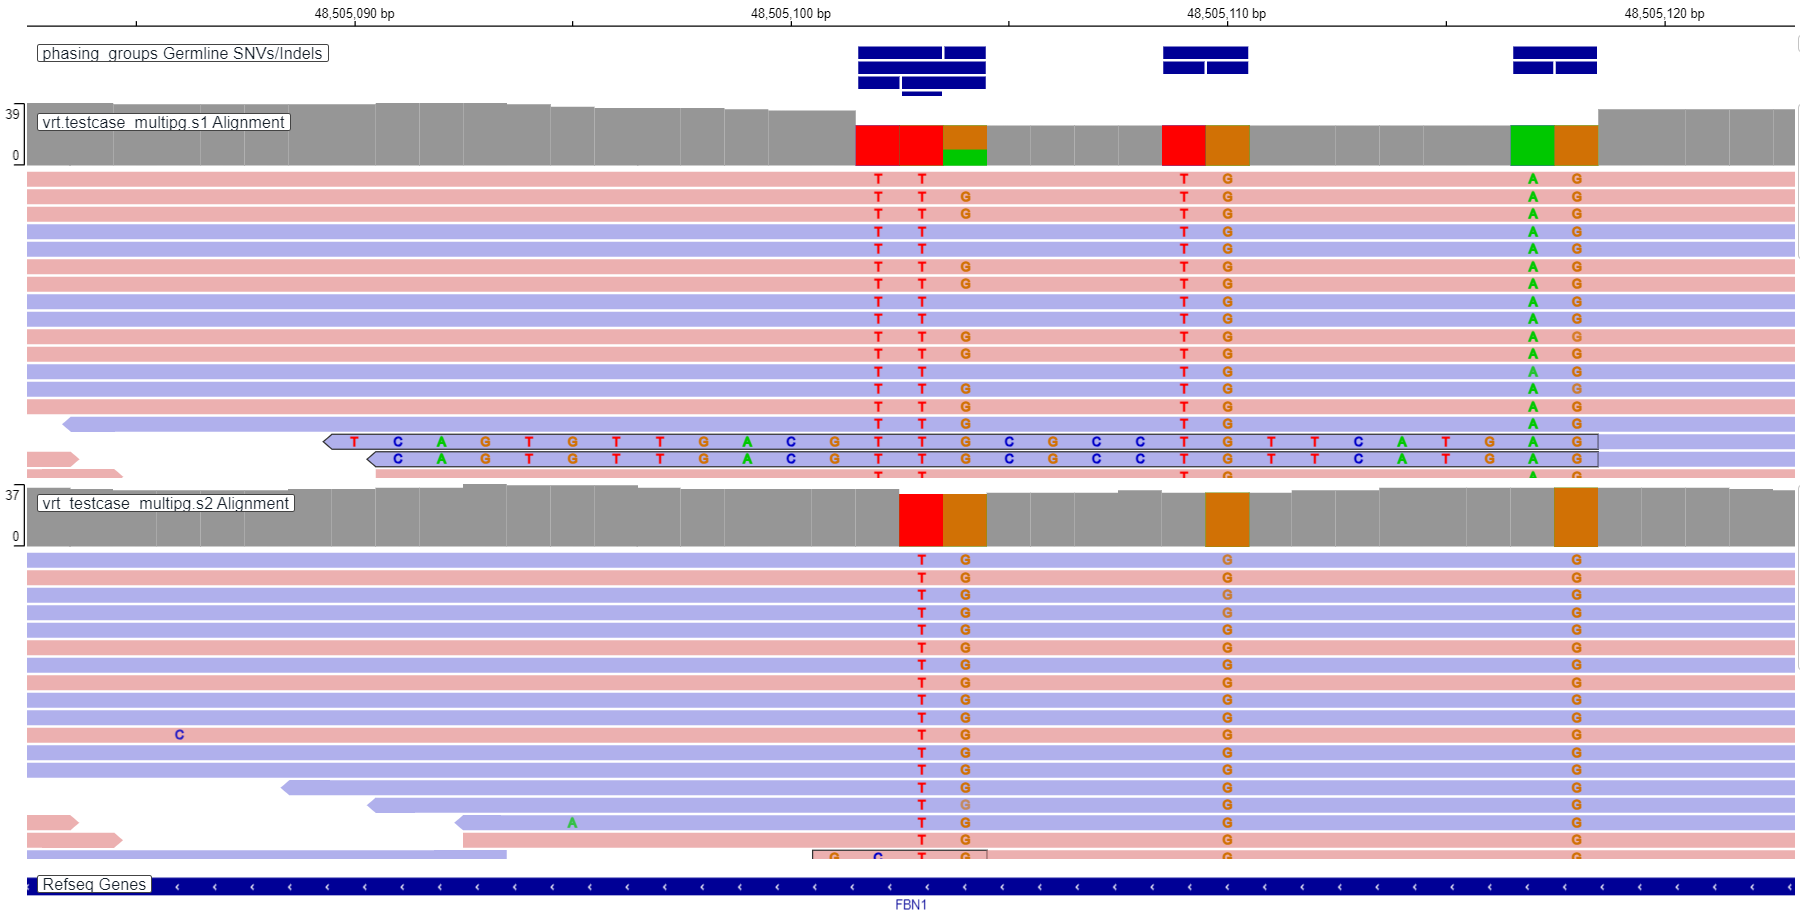
Example of phasing group representation in IGV: phasing groups are located in "phasing groups" track. There are three phasing groups on the left in the track: chr15:48505102 CA>TT (contains 2 variants), chr15:48505102 CAA>TTG (contains 3 variants), chr15:48505103 AA>TG (contains 2 variants). There are one phasing group in the middle of the track: chr15:48505109 CA>TG (contains 2 variants), and one phasing group on the right in the track: chr15:48505117 CA>AG (contains 2 variants).
Gene#
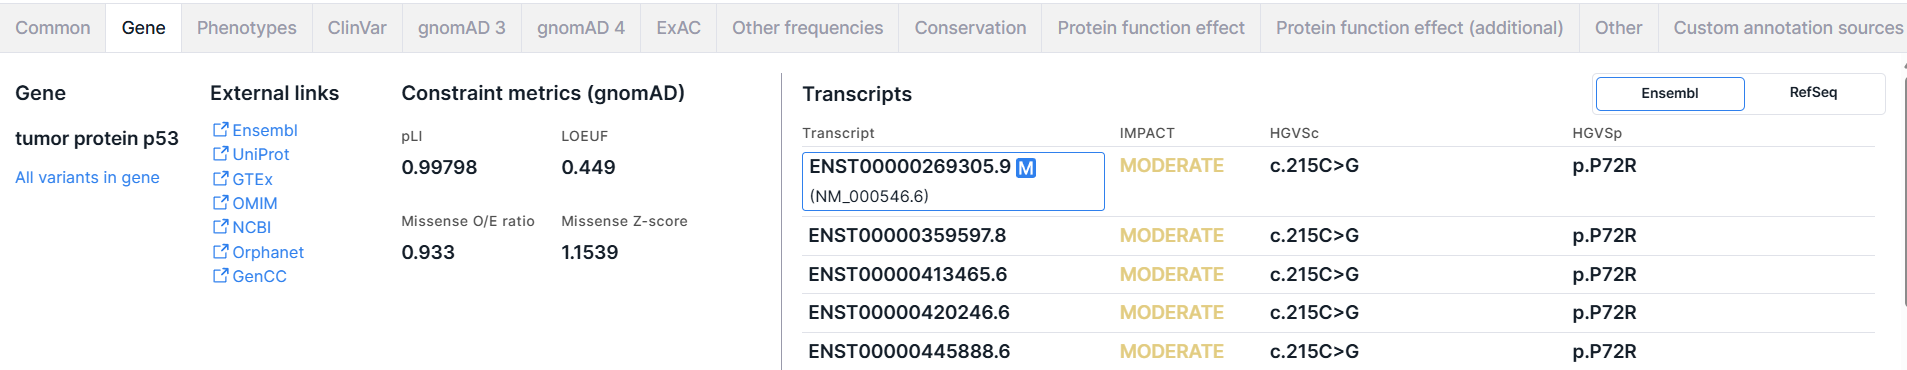
The tab contains basic information about the gene, including constraint gnomAD metrics, and the transcripts in which the variant is located.
1. Gene#
- Official full name. When hovering over the gene name, you can see from which databases it was taken:
- Search for all variants in gene: search for all variants discovered in the sample and located in the same gene. To search, click on "All variants in gene" link and new tab with SNV Viewer filtered by this gene will open.
note
If you make any changes on the new tab, they will be saved in SNV Viewer. In this case, if variants were filtered and/or sorted on the original SNV Viewer page, these filtering and sorting may be reset or changed, and the state of SNV Viewer on the new tab will retain.
2. External links#
Links to pages with information about the gene in various databases: Ensembl, UniProt, GTEx, OMIM, NCBI, Orphanet, GenCC.
3. Constraint metrics (gnomAD)#
Genetic Constraint Metrics — these are metrics that reflect the degree to which a gene is intolerant to functionally significant mutations and help assess the likelihood of pathogenicity:
- pLI (Probability of Loss-of-Function Intolerance) — the probability that a transcript is intolerant to loss-of-function (LoF) variants. This metric indicates the probability that a transcript falls into distribution of haploinsufficient genes, meaning that the loss of one copy leads to functional consequences. It is computed from high-confidence pLoF (predicted LoF) gnomAD data. Range: 0 to 1. Genes with pLI ≥ 0.9 are considered LoF-intolerant.
- LOEUF (Loss-of-function Observed/Expected Upper bound Fraction) — the upper bound of the 90% confidence interval for the observed/expected ratio of high-confidence pLoF (predicted loss-of-function) variants. Lower values (LOEUF < 0.35) indicate a gene is more constrained against LoF variants.
- Missense O/E ratio — the upper bound of the 90% confidence interval for the observed/expected ratio of missense variants. Lower values suggest a gene is more constrained against missense variation.
- Missense Z-score — a Z-score representing the deviation of the observed number of missense variants in a transcript from the expected number under a model of neutral mutation distribution. Greater positive values (Z-score ≥ 3.09) indicate that the transcript is more intolerant of missense variation. Lower or negative Z-scores indicate that the gene tolerates more missense mutations than expected.
4. Transcripts#
The panel contains gene transcripts from two databases: Ensembl and RefSeq. Ensembl transcript models are annotated directly on the reference genome, while RefSeq annotates on mRNA sequences. Due to sequence differences between the reference genomes and individual mRNAs, some of the RefSeq mRNAs may not map perfectly to the reference genome.
By default, a table with transcripts from Ensembl is shown. To open the table with transcripts from RefSeq, click on the corresponding switch button:
![]()
note
On "Profile Settings" page, you can choose which of the gene transcript models will be shown by default.
The gene transcript table from Ensembl has the following columns:
- Transcript is a transcript ID from Ensembl database
(ENSTxxxxxxxxxxx). For the first, main transcript, a transcript from RefSeq
(NM_xxxxxx.x) is also given. You can open the transcript page by clicking on the ID.
The main gene transcript, according to MANE Select,
MANE plus clinical
or Ensembl canonical, is marked
with
 . The gene transcript chosen
as the main one for this variant is framed. Impact, HGVSc, and HGVSp values for this transcript are shown
for the variant in SNV Viewer table.
. The gene transcript chosen
as the main one for this variant is framed. Impact, HGVSc, and HGVSp values for this transcript are shown
for the variant in SNV Viewer table.
- IMPACT is the predicted effect of the variant on the protein (see table with variant impacts values in the annotation). HIGH impact value is colored red, MODERATE is colored yellow, and LOW and MODIFIER are colored gray.
- HGVSc - is a nucleotide substitution using HGVS notation: “c.” (coding; for a substitution in the coding sequence) or “n.” (non-coding; for a substitution in the non-coding sequence) prefix + genomic position of the substituted nucleotide + reference allele > alternative allele.
- HGVSp is an amino acid substitution using HGVS notation: “p.” prefix (protein) + reference amino acid + amino acid position in protein + new amino acid resulting from the substitution.
The gene transcript table from RefSeq has the following columns:
- Transcript is a transcript ID from RefSeq database
(NM_xxxxxx.x). You can open the transcript page by clicking on the ID.
The main gene transcript, according to MANE Select,
MANE plus clinical
or Ensembl canonical, is marked
with . The gene transcript chosen
as the main one for this variant is framed.
- HGVSc - is a nucleotide substitution using HGVS notation: “c.” (coding; for a substitution in the coding sequence) or “n.” (non-coding; for a substitution in the non-coding sequence) prefix + genomic position of the substituted nucleotide + reference allele > alternative allele.
- HGVSp is an amino acid substitution using HGVS notation: “p.” prefix (protein) + reference amino acid + amino acid position in protein + new amino acid resulting from the substitution.
Phenotypes#
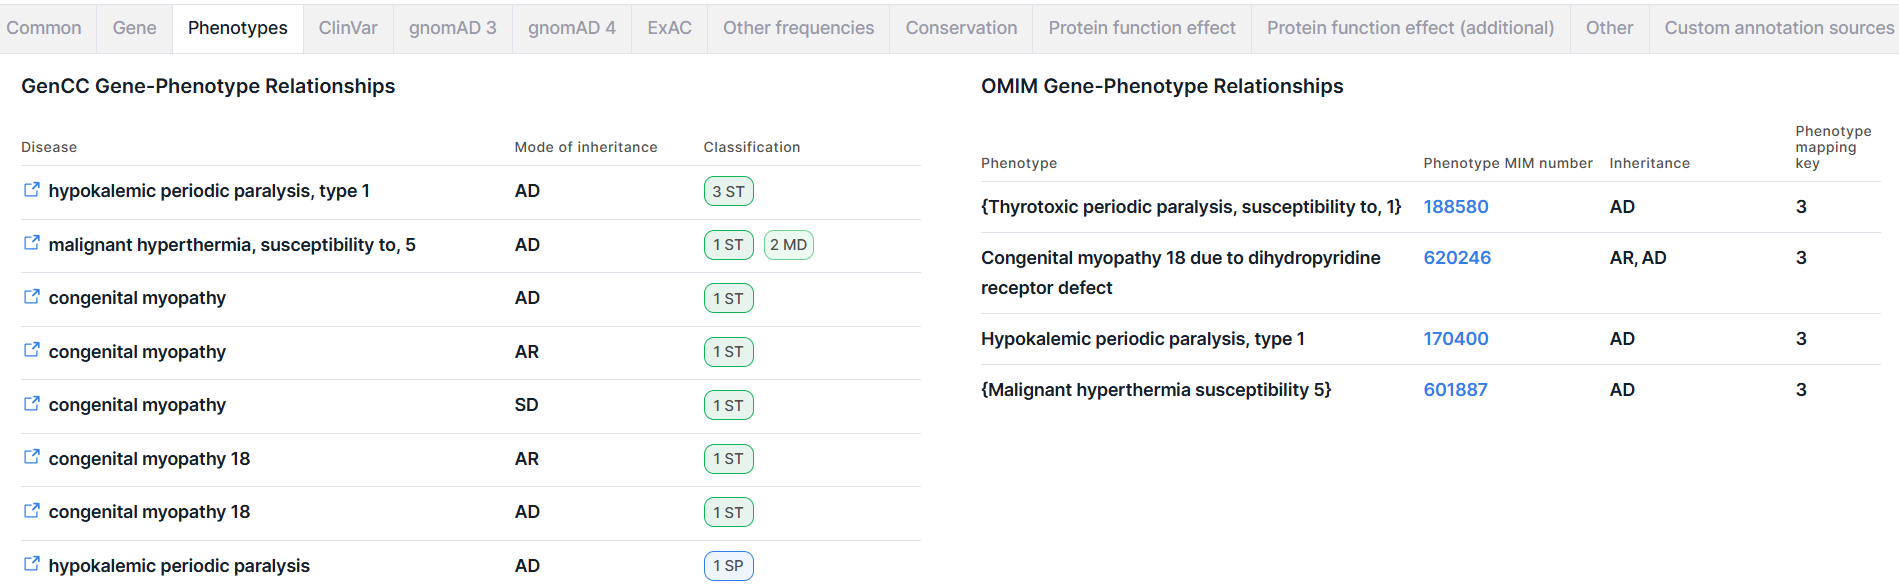
This tab provides information on phenotypes associated with the gene in which the variant is located, based on data from the GenCC and OMIM databases. Information on OMIM phenotypes is provided if you have been granted access to this database.
1. GenCC Gene-Phenotype Relationships#
This section contains information on diseases associated with the gene in which the variant is located, according to the GenCC database.
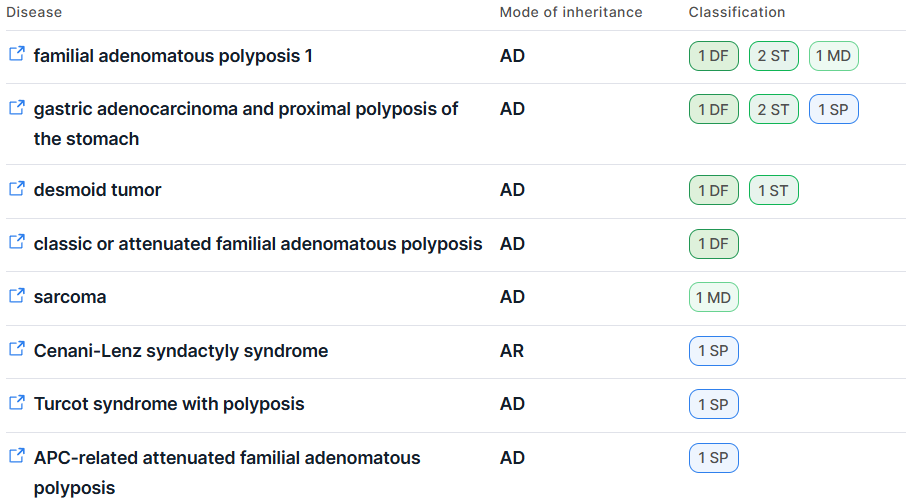
The information is presented in the form of a table with the following columns:
- Disease - the full name of the disease associated with the gene. For each disease, a link to the
corresponding entry in the MONDO ontology (on
the Monarch Initiative consortium website)
is provided:
 . Hovering over the link icon
displays a tooltip with the disease's MONDO ID.
. Hovering over the link icon
displays a tooltip with the disease's MONDO ID. - Mode of inheritance:
- AD - Autosomal dominant;
- AR - Autosomal recessive;
- MI - Mitochondrial;
- SD - Semidominant;
- XL - X-linked;
- XLR - X-linked recessive;
- YL - Y-linked;
- — - Unknown.
- Classification - an assessment of the gene-disease relationship based on the strength of evidence supporting or refuting this association. The classification reflects the level of clinical validity of the gene-disease relationship.
Column values are displayed as icons indicating the number of sources that provided evidence for a given type of relationship. When hovering over an icon, a tooltip is shown with the relationship type and a list of all sources that contributed the corresponding evidence:

Types of gene-disease relationships in GenCC:
 - Definitive;
 - Strong;
 - Moderate;
 - Supportive;
 - Limited;
 - Disputed Evidence;
 - Refuted Evidence;
 - No Known Disease Relationship.
For each disease, all relationship types reported for the given gene in GenCC are displayed. Classification icons are shown in descending order of evidence strength (as listed above).
The table is sorted by gene-disease classification: first by descending strength of evidence, and then by the number of sources providing evidence for each relationship type.
2. OMIM Gene-Phenotype Relationships#
This section contains information on phenotypes associated with the gene in which the variant is located, according to the OMIM database. Access to data from OMIM database inside Genomenal is provided if the user has a license to access the database.
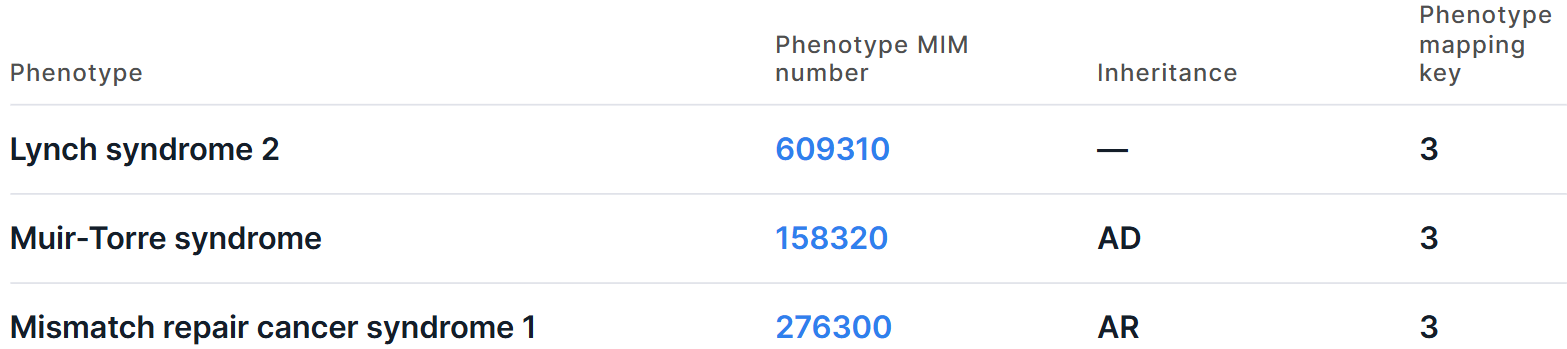
The information is presented in the form of a table with the following columns:
- Phenotype is the full name of the phenotype associated with the gene.
- For some phenotypes, there is a question mark before the name (e.g. "?Bleeding disorder, platelet-type, 22"), which indicates that the relationship between the phenotype and gene is provisional.
- Some phenotypes are enclosed in square brackets (e.g. "[Urate oxidase deficiency]"), which indicates mainly genetic variations that lead to apparently abnormal laboratory test values.
- Some phenotypes are enclosed in curly brackets (e.g. "{Prostate cancer/brain cancer susceptibility, somatic}"), which indicates mutations that contribute to susceptibility to multifactorial disorders or to susceptibility to infection.
- Phenotype MIM number is a phenotype ID in OMIM database. You can open the phenotype page by clicking on the link.
- Inheritance:
- AD - Autosomal dominant;
- AR - Autosomal recessive;
- DD - Digenic dominant;
- DR - Digenic recessive;
- ICB - Inherited chromosomal imbalance;
- IC - Isolated cases;
- Mi - Mitochondrial;
- Mu - Multifactorial;
- SMo - Somatic mosaicism;
- SMu - Somatic mutation;
- XL - X-linked;
- XLD - X-linked dominant;
- XLR - X-linked recessive;
- YL - Y-linked;
- PD - Pseudoautosomal dominant;
- PR - Pseudoautosomal recessive;
- — - Not specified (phenotype has an empty value in the "Inheritance" column in the OMIM database).
- Phenotype mapping key is an OMIM phenotype map key displaying relationships of the
phenotype with associated phenotypes, phenotypic series and genes:
1 - the phenotype is placed on the map due to its association with a gene, but the underlying defect is not known;
2 - the phenotype has been placed on the map by statistical methods, no mutation has been found;
3 - the molecular basis of the disorder is known;
4 - a contiguous gene duplication or deletion syndrome in which multiple genes are involved.
ClinVar#
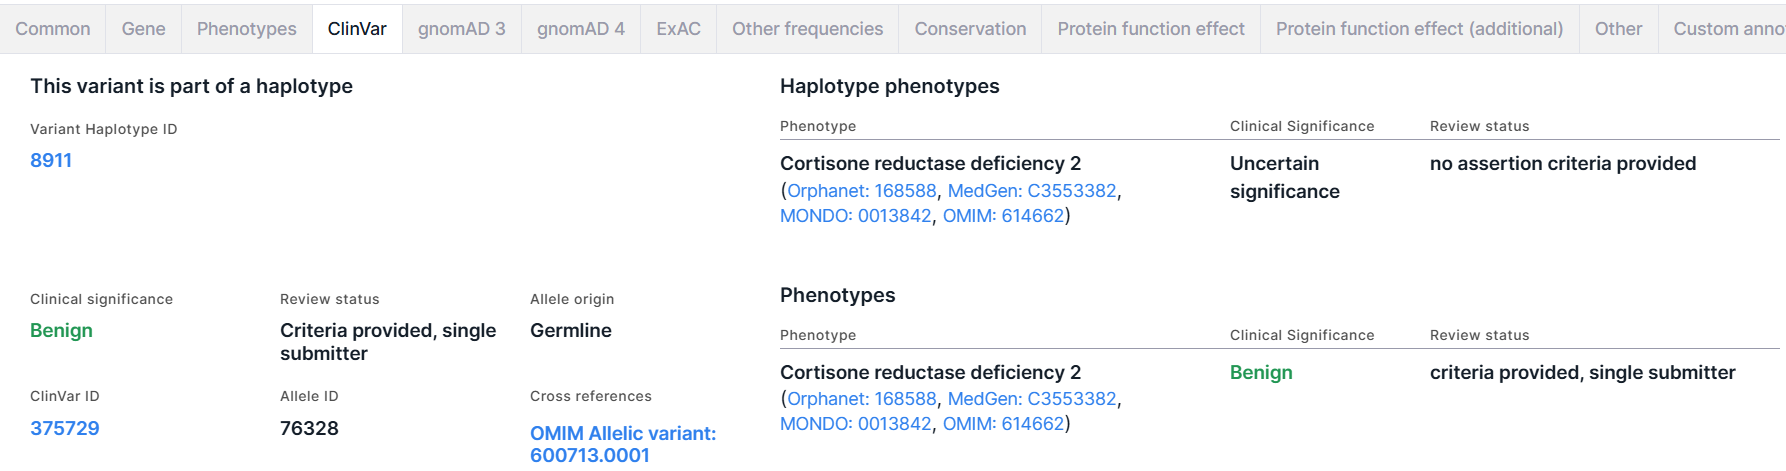
The tab contains information about haplotype phenotype significance, if the variant is part of a haplotype, and about variant phenotype significance from ClinVar database. Both sections contain a table of phenotypes that have been observed in individuals with this haplotype/variant and reported to ClinVar. The table has the following columns:
- Phenotype is a phenotype name (with links to various databases).
- Clinical Significance is a clinical significance of the phenotype (you can find the description of significances here). Benign significance is colored dark green; Likely benign - light green; Likely pathogenic - orange; Pathogenic - red; all other values, including ones mixed from different clinical significances, are colored black.
- Review status is an assessment of the data source in which the clinical significance of the phenotype was reported (you can find the description of review statuses here).
Haplotype Phenotypes#
The section is present on the tab if the variant is part of a haplotype. The section includes:
- Variant Haplotype ID is a haplotype ID in which the variant is included. You can open the haplotype page in ClinVar by clicking on the link.
- A table with phenotypes that have been observed in individuals with this haplotype and reported in ClinVar (see table column descriptions above).
Phenotypes#
The section on the variant phenotype significance includes the following information:
- Clinical significance is the overall clinical significance of all phenotypes that were observed in individuals with this variant and were reported in ClinVar. You can find the description of significances here.
- ClinVar ID is a variant ID in ClinVar. You can open the variant page in ClinVar by clicking on the link.
- Review status is the total assessment of all data sources in which the clinical significance of the phenotypes associated with the variant was reported. You can find the description of review statuses here.
- Allele ID is a variant allele ID in ClinVar.
- Allele origin is a total allele origin of the variant in different sources provided by ClinVar.
- Cross references are links to a variant in various databases.
- A table with phenotypes that have been observed in individuals with this variant and reported in ClinVar (see table column descriptions above).
gnomAD 3#
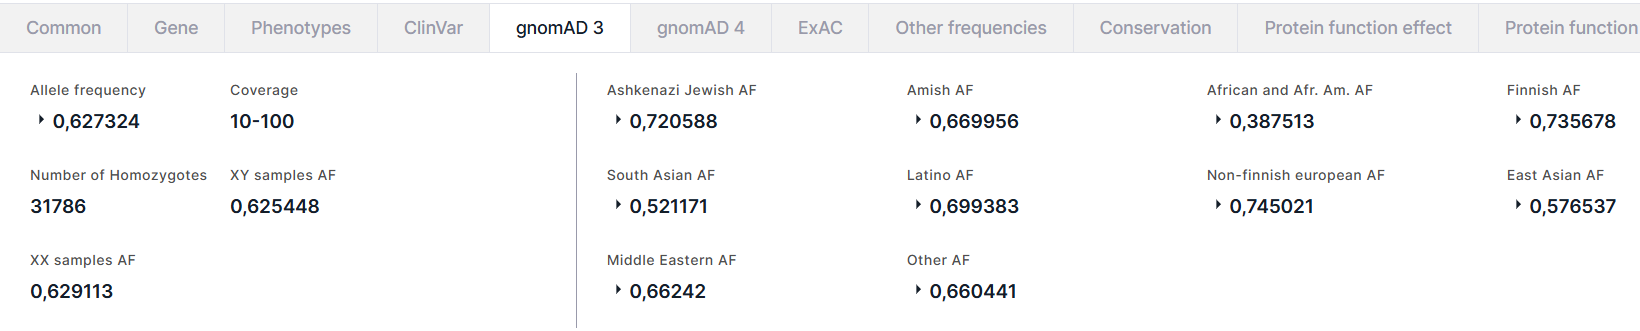
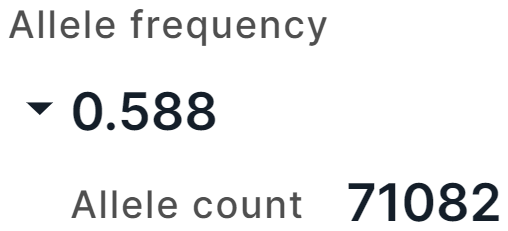
The tab contains the information about allele frequencies of the variant from the gnomAD v3 database. On the left, there is a general information about the variant:
- Allele frequency is a total alternative allele frequency of the variant in high quality genotypes. For AF, there are AC, that is the alternative allele count in high quality genotypes, and AN, that is the total number of called high quality genotypes.
- Coverage is a median per-base depth of coverage binned to rages <10, 10-100, ⩾100.
- Number of Homozygotes is a number of individuals homozygous for alternative allele.
- XY samples AF is a total alternative allele frequency in XY subpopulation.
- XX samples AF is a total alternative allele frequency in XX subpopulation.
On the right, there are variant frequencies in different populations: Ashkenazi Jewish, Amish, African and African American (Afr. Am.), Finnish, South Asian, Latino, Non-finnish european, East Asian, Middle Eastern and Other (includes the samples that were not uniquely assigned to other ancestries by the random forest model). For each population, there are total alternative allele frequency (AF) in high quality genotypes in the population, AFs in XY and XX subpopulations, and the number of homozygotes in the population:

gnomAD 4#
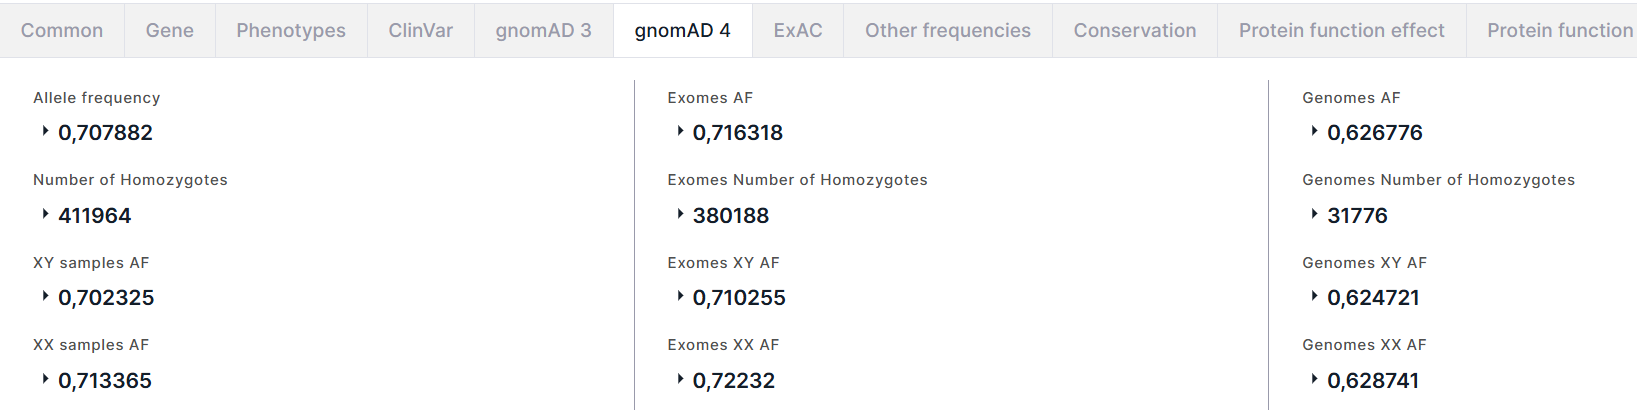
The tab contains the information about allele frequencies of the variant from the gnomAD v4 database. The tab presents three columns with information about allele frequencies: on the left, there is total information (in exomes and genomes); in the middle, there is only data in exomes; on the right, there is only data in genomes. The fields in these columns are identical:
- Allele frequency (AF) is the alternative allele frequency of the variant in high quality genotypes. For AF, there are AC, that is the alternative allele count in high quality genotypes, and AN, that is the total number of called high quality genotypes.
- Number of Homozygotes is the number of individuals homozygous for alternative allele. For number of homozygotes, XY samples and XX samples are given, that are the numbers of individuals homozygous for alternative allele in the XY subpopulation and the XX subpopulation, respectively.
- XY samples AF (XY AF) is the alternative allele frequency in the XY subpopulation. For AF, there are XY samples AC (XY AC), that is the alternative allele count in high quality genotypes in the XY subpopulation, and XY samples AN (XY AN), that is the total number of called high quality genotypes in the XY subpopulation.
- XX samples AF (XX AF) is the alternative allele frequency in the XX subpopulation. For AF, there are XX samples AC (XX AC), that is the alternative allele count in high quality genotypes in the XX subpopulation, and XX samples AN (XX AN), that is the total number of called high quality genotypes in the XX subpopulation.
ExAC#
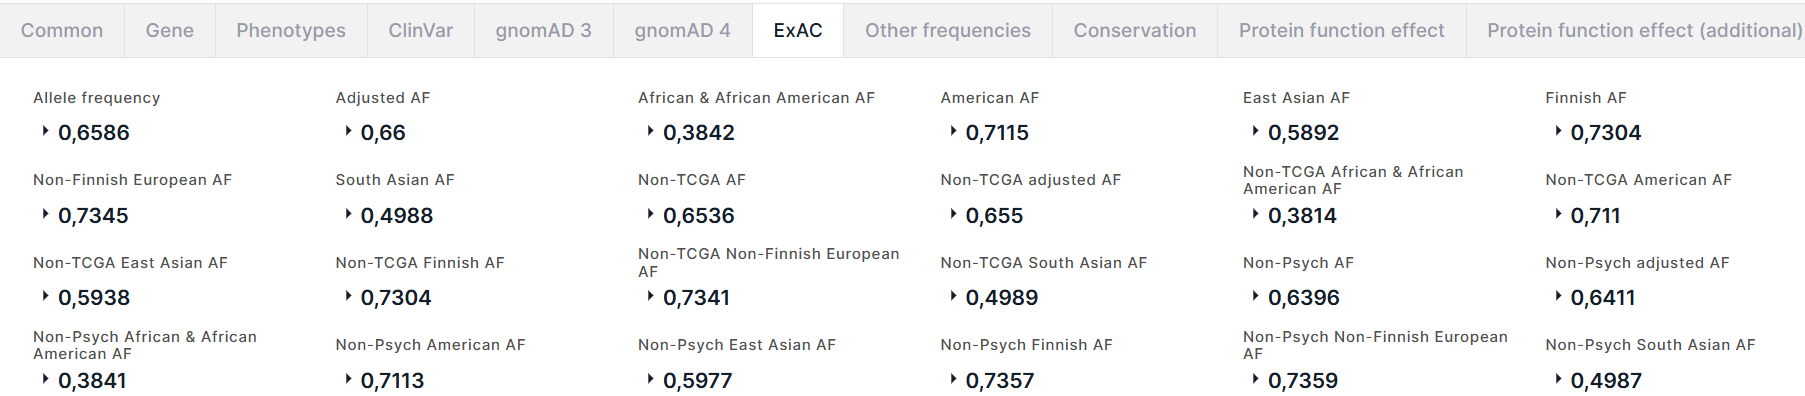
The tab contains information about the allele frequencies of the variant in ExAC database:
- Allele frequency is a total alternative allele frequency of the variant.
- Adjusted AF is an alternative allele frequency of the variant in the population with genotype quality ≥20 and depth of coverage ≥10.
- Alternative allele frequencies in African and African American, American, East Asian, Finnish, Non-Finnish European, South Asian populations.
- Alternative allele frequencies in non-TCGA (cohort from which normal tissue samples from cancer patients were excluded) and non-Psych (cohort from which normal tissue samples from patients with mental disorders were excluded) cohorts: a total alternative allele frequency (AF) in cohort, AF in cohort of the population with genotype quality ≥20 and depth of coverage ≥10 (adjusted AF), and AFs in cohort of different populations: African and African American, American, East Asian, Finnish, Non-Finnish European, South Asian.
For each frequency, there is an alternative allele count in high quality genotypes (Allele count):
Other Frequencies#
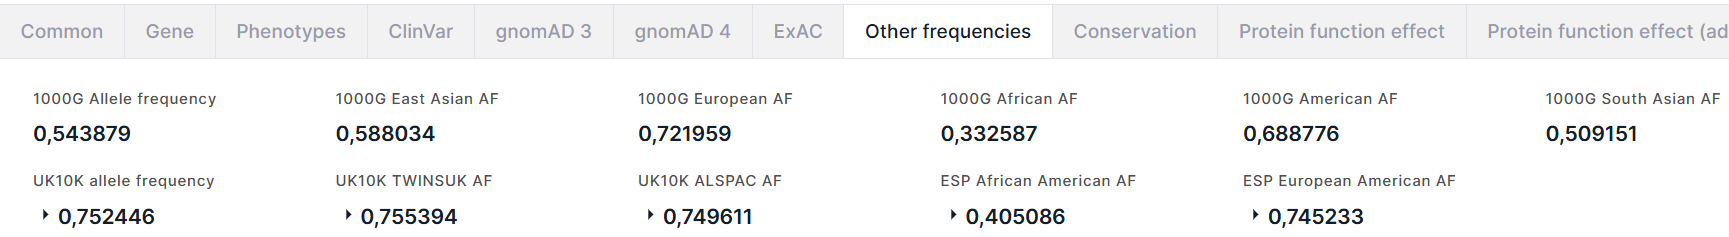
The tab contains information about the allele frequencies of the variant from 1000 Genomes (1000G), UK10K and NHLBI GO Exome Sequencing Project (ESP) projects.
From 1000 Genomes project, there are:
- Allele frequency is a total alternative allele frequency of the variant;
- Alternative allele frequencies in East Asian, European, African, American, South Asian populations.
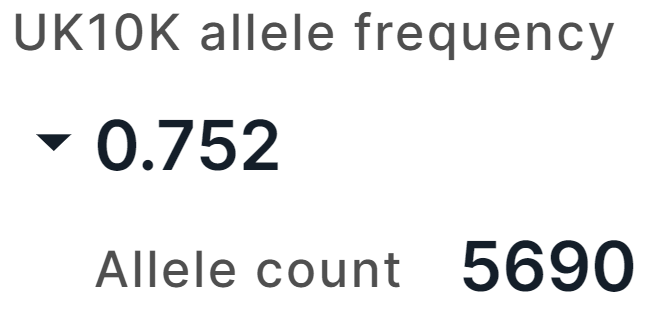
From UK10K project, there are:
- Allele frequency is a total alternative allele frequency of the variant in combined genotypes in UK10K cohort (TwinsUK + ALSPAC);
- TWINSUK AF is an alternative allele frequency in TwinsUK, that is a cohort of adult twins living in the UK;
- ALSPAC AF is an alternative allele frequency in ALSPAC, that is a cohort of fetuses.
From ESP project, there are alternative allele frequencies in African American and European American populations.
For frequencies from UK10K and ESP projects, there is an alternative allele count in high quality genotypes (Allele count):
Conservation#
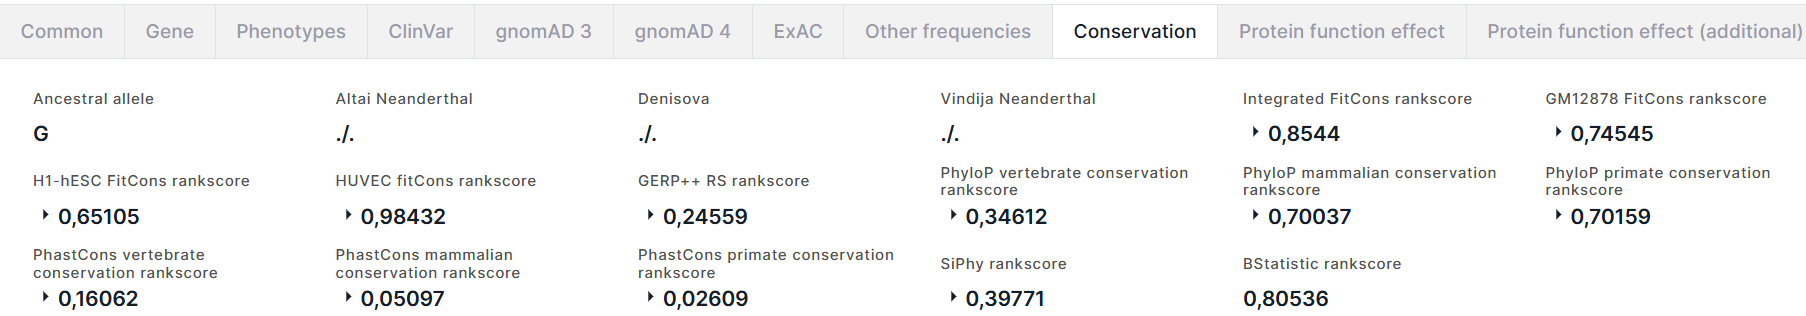
The tab contains the information on the variant conservation:
- Ancestral allele inferred from the Enredo-Pecan-Ortheus (EPO) multiple alignments using a probabilistic method Ortheus. ACTG - high-confidence alleles, ancestral state supported by the other two sequences; actg - low-confidence alleles, ancestral state supported by one sequence only; N - failure, the ancestral state is not supported by any other sequence; - - the extant species contains an insertion at this position; . - no coverage in the alignment.
- Altai Neanderthal is a genotype of a deep-sequenced Altai Neanderthal.
- Denisova is a genotype of a deep-sequenced Denisova.
- Vindija Neanderthal is a genotype of a deep-sequenced Vindija Neanderthal.
- Conservation scores for the variant position in the genome estimated using fitCons method. fitCons is a computational method that estimates the likelihood of a mutation at any genomic position to affect fitness. It integrates functional assays (such as ChIP-Seq) with selective pressure inferred using the INSIGHT method. The result of the prediction is a score ρ in the range [0-1] that indicates the fraction of genomic positions evincing a particular pattern of functional assay results, that are under selective pressure. From fitCons results, there are Integrated FitCons rankscore, that is an integrated score obtained by combining scores from three cell lines (HUVEC, H1 hESC and GM12878), and GM12878 FitCons rankscore, H1-hESC FitCons rankscore, HUVEC fitCons rankscore, that are conservation scores in GM12878, H1 hESC and HUVEC cell lines, respectively. For each rankscore, there are also score and confidence value.
- Conservation scores for the variant position in the genome estimated using GERP++ program. GERP (Genomic Evolutionary Rate Profiling) identifies constrained elements in multiple alignments by quantifying substitution deficits. These deficits represent substitutions that would have occurred if the element were neutral DNA, but did not occur because the element has been under functional constraint. GERP authors refer to these deficits as "Rejected Substitutions" (RS). RS score is defined as the number of substitutions expected under neutrality minus the number of substitutions "observed" at the position. From GERP++ results, there are GERP++ RS rankscore, neutral rate and score.
- PhyloP vertebrate conservation rankscore, PhyloP mammalian conservation rankscore and PhyloP primate conservation rankscore, and corresponding scores are conservation scores derived from alignment of vertebrate, mammalian, and primate species, respectively, by PhyloP (phylogenetic P-values) program. Interpretations of the scores are compared to the evolution that is expected under neutral drift.
- PhastCons vertebrate conservation rankscore, PhastCons mammalian conservation rankscore and PhastCons primate conservation rankscore, and corresponding scores are conservation scores derived from alignment of vertebrate, mammalian, and primate species, respectively, by phastCons program. PhastCons is a program for identifying evolutionarily conserved elements in a multiple alignment, given a phylogenetic tree. It is based on a phylogenetic hidden Markov model.
- SiPhy rankscore and score are conservation scores for the variant position in the genome estimated by SiPhy using a simple generalization of the substitution pattern estimation.
- BStatistic rankscore is a conservation score for the variant position in the genome, derived from analysis of the genomic distributions of human polymorphisms and sequence differences among five primate species relative to the locations of conserved sequence features (you can read more here).
Protein function effect#
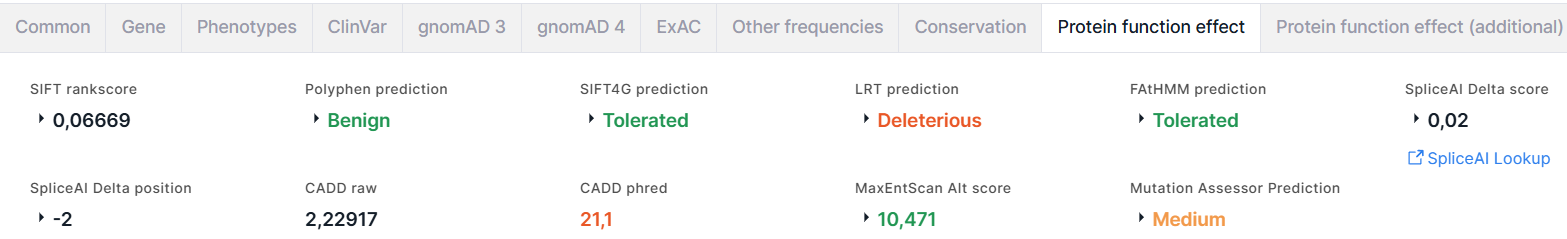
The tab contains the results of the prediction of amino acid substitution effect on protein function, obtained using the following algorithms and programs:
- SIFT (Sorting Intolerant From Tolerant) predicts whether an amino acid substitution affects protein function basing on sequence homology and the physical properties of amino acids. The result of the prediction is rankscore and score, the values of which vary from 0 to 1. An amino acid substitution is considered damaging if score ≤ 0.05 and tolerated if score > 0.05.
- PolyPhen (Polymorphism Phenotyping) predicts possible
impact of an amino acid substitution on the structure and function of a protein using
sequence homology and different databases and tools. The result is:
1. prediction: Benign (colored green); Possibly damaging (colored orange); Probably damaging (colored red);
2. score whose values vary from 0 to 1: the lower, the more likely that the variant is benign, the higher - damaging. - SIFT4G (SIFT Databases for Genomes) is a faster version of SIFT. The result of SIFT4G is prediction: Tolerated (colored green), or Damaging (colored red); score; rankscore.
- LRT (Likelihood Ratio Test) identifies deleterious mutations that disrupt highly conserved amino acids within protein-coding sequences basing on the evolutionary models of the DNA sequence. The result is prediction: Neutral (colored green), or Deleterious (colored red); score; rankscore; omega.
- FAtHMM (Functional Analysis through Hidden Markov Models) predicts the functional consequences of both coding variants and non-coding variants basing on sequence homology. The result is prediction: Tolerated (colored green), or Damaging (colored red); score; rankscore.
- SpliceAI is a deep neural network that predicts
the probability of the position to be a splice acceptor or donor from a pre-mRNA sequence.
The result is:
1. Delta score (DS) is the probability of the variant being splice-altering at any position within a given interval (+/-50 bp between the variant and gained/lost splice site by default). Delta scores range from 0 to 1:
- Acceptor gain is the probability of a position within a given interval to be splice acceptor;
- Acceptor loss is the probability of a position within a given interval not to be splice acceptor;
- Donor gain is the probability of a position within a given interval to be splice donor;
- Donor loss is the probability of a position within a given interval not to be splice donor.
DS is defined as the maximum of these four scores. Values 0 ≤ DS < 0.2 are colored black, 0.2 ≤ DS < 0.5 - green,
0.5 ≤ DS < 0.8 - orange, 0.8 ≤ DS ≤ 1 - red.
2. Delta position conveys information about the location where splicing changes relative to the variant position (positive values are downstream of the variant, negative values are upstream). Delta positions corresponds to the DS scores.
3. Link to SpliceAI Lookup website for more detailed information about the scores for the variant. - CADD (Combined Annotation-Dependent Depletion) scores the
deleteriousness of a variant by integrating multiple annotations into one metric by contrasting variants
that survived natural selection with simulated mutations. The result is:
- Raw score has relative meaning and is interpretable as the extent to which the annotation profile for a variant suggests that the variant is likely to be "observed" (negative values) vs "simulated" (positive values). Higher values indicate that a variant is more likely to have deleterious effect.
- Phred is a Phred-scaled score. Phred < 10 is colored green, 10 ≤ Phred < 20 - orange, Phred ≥ 20 - red. - MaxEntScan predicts
the fitness of a variant position as either a donor or an acceptor splice site based on a maximum entropy model.
The result of prediction is scores for alternative (Alt score) and reference (Ref score) alleles necessary
to predict the loss of a native splice site for a variant. The difference between these scores (Diff) is also
given.
Alt score < -19 is colored red, -19 ≤ Alt score < -3 - orange, Alt score ≥ -3 - green. - MutationAssessor predicts the functional impact of variant amino acid
substitution in proteins basing on evolutionary conservation of the affected amino acid in protein homologs.
The result is:
1. Prediction: predicted functional, i.e. High (colored red) or Medium (colored orange), or predicted non-functional, i.e. Low or Neutral (both are colored green).
2. Score. Score ≥ 3,5 corresponds to the high impact, 3,5 < Score ≤ 1,935 - to the medium impact, 1,935 < Score ≤ 0,8 - to the low impact, 0,8 < Score - to the neutral impact.
Additional results of the prediction of amino acid substitution effect on protein function are located on Protein function effect (additional) tab:
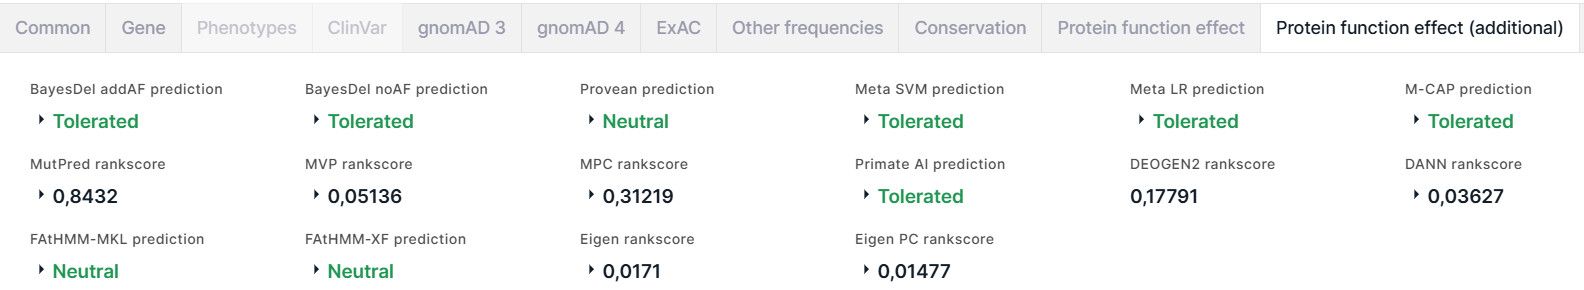
- BayesDel is a variant deleteriousness meta-score. It works for coding and
non-coding variants, single nucleotide variants and small indels. The higher the score, the more likely the variant
is pathogenic. The result is:
1. addAF prediction is a prediction of deleteriousness meta-score with inclusion of MaxAF (the maximum allele frequency across populations): Tolerated (colored green) or Damaging (colored red). For the prediction value, addAF score and addAF rankscore are given, on the basis of which the prediction was made. The score cutoff between damaging and tolerated prediction values is 0.0692655.
2. noAF prediction is a prediction of deleteriousness meta-score without inclusion of MaxAF: Tolerated (colored green) or Damaging (colored red). For the prediction value, noAF score and noAF rankscore are given, on the basis of which the prediction was made. The score cutoff between damaging and tolerated prediction values is -0,0570105. - PROVEAN (Protein Variation Effect Analyzer) predicts whether an amino acid substitution has an impact on the biological function of a protein. The result is prediction: Neutral (colored green) or Damaging (colored red); score; rankscore.
- Meta SVM is a meta-analytic support vector machine (SVM) that accommodates 10 component scores (SIFT, PolyPhen-2 HDIV, PolyPhen-2 HVAR, GERP++, MutationTaster, MutationAssessor, FATHMM, LRT, SiPhy, PhyloP) and the maximum frequency observed in the 1000 genomes populations. The result is prediction: Tolerated (colored green) or Damaging (colored red); score; rankscore; reliability index.
- Meta LR is a meta-analytic logistic regression (LR) that accommodates 10 component scores (SIFT, PolyPhen-2 HDIV, PolyPhen-2 HVAR, GERP++, MutationTaster, MutationAssessor, FATHMM, LRT, SiPhy, PhyloP) and the maximum frequency observed in the 1000 genomes populations. The result is prediction: Tolerated (colored green) or Damaging (colored red); score; rankscore; reliability index.
- M-CAP (Mendelian Clinically Applicable Pathogenicity) is a pathogenicity classifier for rare missense variants in the human genome that is tuned to the high sensitivity required in the clinic. It combines various pathogenicity scores (including SIFT, Polyphen-2 and CADD) with novel features and a powerful model. The result is prediction: Tolerated (colored green) or Damaging (colored red); score; rankscore.
- MutPred classifies an amino acid substitution as disease-associated or neutral and predicts molecular cause of disease. The result is rankscore, score, transcript ID (from UniProtKB), amino acid change, top 5 features. Higher score values indicate that a variant is more likely to have deleterious effect.
- MVP (Missense Variant Pathogenicity) is a prediction method that uses deep residual network to leverage large training data sets and many correlated predictors. The result is rankscore and score.
- MPC (Missense badness, PolyPhen-2, and Constraint) is a de novo missense deleteriousness metric based on identifying sub-genic regions that are depleted of missense variation. The result is rankscore and score. Higher score values indicate that a variant is more likely to be pathogenic.
- Primate AI is a deep residual neural network for classifying the pathogenicity of missense mutations based on the common missense variants in non-human primate species. The result is prediction: Tolerated (colored green) or Damaging (colored red); score; rankscore.
- DEOGEN2 is a method that predicts whether a protein-coding variant likely affects the carrier individual's health. The method incorporates heterogeneous information about the molecular effects of the variants, the domains involved, the relevance of the gene and the interactions in which it participates. The result of the prediction is rankscore.
- DANN (Domain-Adversarial Neural Network) is a deep neural network trained on the same feature set and training data as CADD. The result is rankscore and score. Higher score values indicate that a variant is more likely to have deleterious effect.
- FAtHMM-MKL (Multiple Kernel Learning) is a machine learning approach that integrates functional annotations from ENCODE with nucleotide-based sequence conservation measures. The result is prediction: Neutral (colored green) or Damaging (colored red); p-value; rankscore; group of features.
- FAtHMM-XF (eXtended Feature) is a method for predicting pathogenic point mutations in the human genome based on an extensive feature set. It outperforms competitors particularly in non-coding regions. The result is prediction: Neutral (colored green) or Damaging (colored red); p-value (lower p-value indicate that a variant is more likely to have deleterious effect); rankscore.
- Eigen is a spectral approach integrating functional genomic annotations for coding and non-coding variants. The result is rankscore and score.
- Eigen-PC is a conceptually simpler meta-score, which is based on the decomposition of the annotation covariance matrix, and using the lead vector to weight the individual annotations. The result is rankscore, score and score in phred scale.
Other#
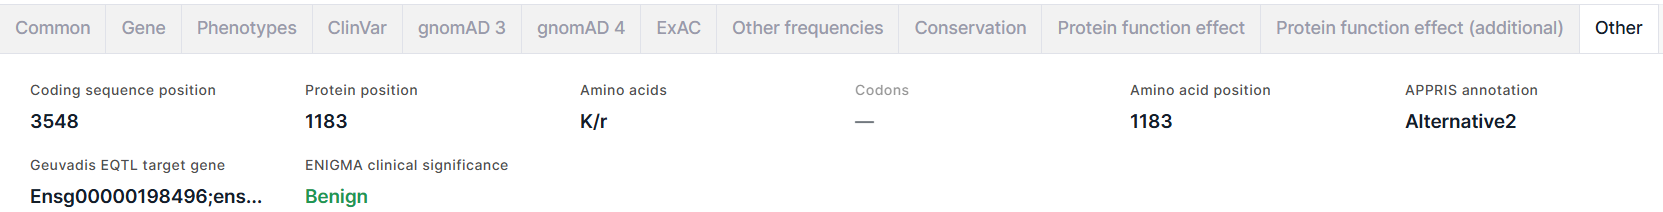
The tab contains additional information about the variant:
- Coding sequence position is a genomic position of a variant reference allele.
- Protein position is a reference amino acid position in protein.
- Amino acids: reference amino acid / new amino acid resulting from the substitution.
- Codons is an amino acid substitution written as codons (e.g. GAG/CAG = E/Q (Glutamic acid -> Glutamine)).
- Amino acid position is a reference amino acid position in protein.
- APPRIS annotation is an annotation of principal splice isoforms of human. The isoform for each gene is selected as the principal one by combining protein structural information, functionally important residues and evidence from cross-species alignments. Possible annotation values: PRINCIPAL1-5 (principal isoforms, with 1 being the most reliable), ALTERNATIVE1 (candidate transcript model conserved in at least three tested non-primate species), ALTERNATIVE2 (candidate transcript model conserved in fewer than three tested non-primate species).
- Geuvadis EQTL target gene is target gene IDs from Ensembl identified by the analysis of expression quantitative trait loci (eQTL) in GEUVADIS (Genetic European Variation in Disease) project.
- ENIGMA clinical significance is a clinical significance of the variant if it's located in the known or suspected breast and/or ovarian predisposition genes (such as BRCA1, BRCA2) determined by ENIGMA consortium. Benign significance is colored dark green; Likely benign - light green; Likely pathogenic - orange; Pathogenic - red; all other values, including ones mixed from different clinical significances, are colored black. When hovering over a field value, you will see a comment on clinical significance.
Custom annotation sources#
The tab is present in the details panel if at least one custom annotation was added to the system before the variants in the sample were annotated. The tab contains the column values from the custom annotations that the variant was annotated with:

Deleted annotation data are marked "deleted" for variants that were annotated with it before it was deleted.